

Policy making on every level, from a federal government all the way down to municipalities, is a complex machine that requires consideration of a variety of stakeholders and information coming from many different sources. There is also the challenge of relaying complex, and sometimes quite sensitive, information to a diverse public who needs to buy into these changes if they are actually going to both pass any legislation and stick for the long-term. One tool that nearly every locality is using in some way today is GIS, providing crucial spatial complex to localities with countless layers of data that come into play differently for a variety of different departments.
This is perhaps the most important use of GIS, and something that we’ve covered extensively here at Geo Week News. Policy makers both in the United States and abroad lean heavily on GIS tools to contextualize important issues and use that information to influence their policy decisions and disperse this information to the public. Whether it be for climate-related activity, responding to disasters, or building up new developments, we have a handful of recent case studies highlighting how GIS has been used by policymakers all around the world. Find the full articles below.

How Kaua'i County uses GIS to future-proof development
We start with a local county government in Hawaii with an article focusing on a first-of-its-kind “Sea Level Rise Constraint District.” In the linked article, Geo Week News spoke to administrative planning officer Alan Clinton about how this district came to be, some of the logistics behind its usage, and some of the overarching climate concerns in the area. For context, this is a community on the coast in Hawaii that is dealing with sea level rise, and the county created a GIS basemap overlaid with projected sea level rise. With this data, they were able to codify a law with requirements for new construction and extensive renovations to take sea level rise into account.
Raleigh’s Embrace of Technology to Address Heat, and Other Issues
Now, we head back to the mainland in the United States to Raleigh, North Carolina, which has a reputation for being a city that embraces technology, and specifically GIS. This was backed up by Geo Week News’ conversation with Jim Alberque, Raleigh’s GIS and emerging technologies manager. This conversation focused heavily on the city’s work in mitigating effects from urban heat islands, a process which utilized not only GIS tools but also weather sensors and other data collection to create a digital twin. All of this has been used to enact policies already, including around tree planting and new ways to treat pavement.
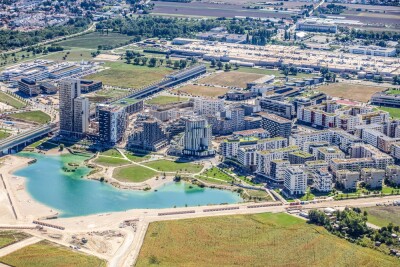
Inside One of Europe's Largest Urban Development Projects
Esri is, of course, the leader in GIS technology with their ArcGIS being the preferred solution for a large number of municipalities and other governments around the world. This article was contributed by Brooks Patrick, a Global Business Development Manager for Smart Cities with Esri, and moves the focus over to Europe. More specifically, it focuses on the city of Vienna, Austria, which is dealing with massive population growth and needs to develop to accommodate their new residents. The article talks about the development of this massive urban project and how GIS has played a crucial role.
How GIS is being used to combat sea level rise in Norfolk
For this article we go to a similar issue discussed in the first link above with more concern around sea level rise. This time we’re in Norfolk, Virginia, a city right along the coast that also has multiple rivers running through that effectively makes the municipality surrounded by water. This, combined with increasingly strong storms leads to flooding that is becoming more common and damaging. This article includes commentary from Dr. George McLeod, director of the Center for Geospatial Science, Education, and Analytics (GeoSEA) at Old Dominion, and Keith VanGraafeiland, a product engineer with Esri, about how GIS is being used to plan around these potential sea level rise issues.

Digital twins in the fight to mitigate urban heat islands
When we talk about the effects of urban heat islands, the main underlying cause is generally a lack of green and natural assets that would normally absorb some of this heat, instead being replaced by concrete and other manmade structures. Dense cities are becoming more necessary with increasing urbanization, but it’s a fine line to ensure there is enough green space to keep these heat concerns to a minimum as global temperatures rise. This was the focus of a project from a team of researchers at Cornell, who created a digital twin web tool to track and simulate shading effects from every tree across New York City.
How Humanitarian OpenStreetMap Team is working to map areas affected by disaster
For the most part, these articles have focused around planning for long-term effects, whether they be climate concerns or building developments, but governments also need to be prepared for unexpected crises like natural disasters. This article looks at the work OpenStreetMap does to help municipalities react to disasters, with this particular article focusing on the work the Humanitarian OpenStreetMap Team did following a devastating earthquake in Turkey and Syria early last year.