
When electricity distribution company Fortis BC wished to upgrade out-of-date copper distribution lines in a neighborhood within the small, rural town of Oliver, British Columbia, Canada, they hoped the cable replacement work would improve the efficiency of the electricity supply across the neighborhood. However, Fortis did not have an up-to-date view of their existing power lines, or a model of their assets in the town of Oliver. They also needed to establish what assets they had and where in order to plan the work, and therefore sought new ways to map and review their assets.
Creating a 3D digital view of the roads
Routescene customer Rekon Solutions, a professional lidar drone service provider, undertook a powerline survey combining both vehicle-based lidar mapping system and UAV-based lidar. The data was used to create a 3D digital view of the roads and Fortis assets to enable detailed planning of the works and materials needed.
The primary reason for undertaking a lidar-based survey for this project is that lidar data enables the instant production of a 3D model of the power lines, whereas producing an equivalent using photogrammetry requires extensive processing. Also, lidar is not affected by poor light and shadows.
In addition, the Routescene UAV lidar solution is a high-resolution, survey-grade system and has the advantage of being able to capture thin power lines in great detail. The survey results provided the team with accurate representations of trees, telegraph poles, transmission lines, road curbs, manhole covers, electricity poles, guy ropes and electricity entry points into houses. With this detailed data the team could calculate the height and sag of power lines.
A change of plans
Vashaun Henderson, Operations Manager at Rekon, had initially planned to conduct lidar surveys of the area using their Unmanned Aerial Vehicle (UAV) with the Routescene LidarPod mounted underneath. For this particular survey, Rekon had initially planned to conduct the whole survey using the drone and to capture the data in as few flights as possible. However, on a reconnaissance of the site, the survey approach was altered: the location of the survey, a town with a good road network where the majority of the power lines to be mapped could be surveyed from those roads, meant it lent itself to mobile mapping.

The flexible Routescene lidar system has been designed so it can be mounted under a drone or alternatively onto a vehicle. It was clear to the team that 95% of the data could be captured using mobile mapping. The lidar system was mounted onto a drone for the difficult to reach section of the survey site close to a river as this was much safer and easier to capture this way. The whole survey was undertaken in two passes – one mobile mapping pass and one drone pass.
Comparing drone-based mapping and mobile mapping
Using this combination of vehicle and UAV based data collection allowed Rekon and their client to save money and time during this project. In total, the project took one hour of mobile mapping and one 15-20 minute drone flight to complete the data collection phase. The survey totaled to 4.9km (4,900 m) of road. Theoretically, at 30 km/h using mobile mapping the 4.9 km of road could be completed in 10 minutes. However, due to the nature of the survey site, an urban area which was not linear with many small connecting roads, the survey took 1 hour, which is 6 times longer than the theoretical calculation.
Theoretically, flying at 5 m/s, the 4.9 km of road could be covered in 2 flights with the drone, with a total flight time of 32-33 minutes. But because this was an urban survey site, this would have required many more take off and landings to battery changes and to remain within line of sight. For each takeoff and landing, the team would need to move all the equipment by car to the new landing site. There is a balance to be assessed between the amount of time flying and surveying and the amount of time undertaking logistics / moving equipment. For this particular project, it was not efficient to undertake all the survey using a drone, as the time spent planning and undertaking logistics would have outweighed the time spent collecting data (4-5 hours in total).
Ground control and data collection
Unlike photogrammetry, lidar is not affected by light conditions or shadows and can be collected quickly and easily from the safety of a moving truck. This gives the flexibility to survey at night, particularly useful for highway projects when traffic is lighter. Routescene’s vehicle lidar kit includes a roof rack which has a specially developed shock absorption system to reduce vibrations from an uneven road surface. This allows the best possible results to be obtained.
During August 2020, in temperatures of 40°C, the Rekon team partnered with survey company Allterra Land Surveying to undertake the survey. Allterra prepared all the ground control points the day before the survey, which were used to calibrate for drift, which is typical in any longer vehicle survey.
Monitoring data quality in real-time
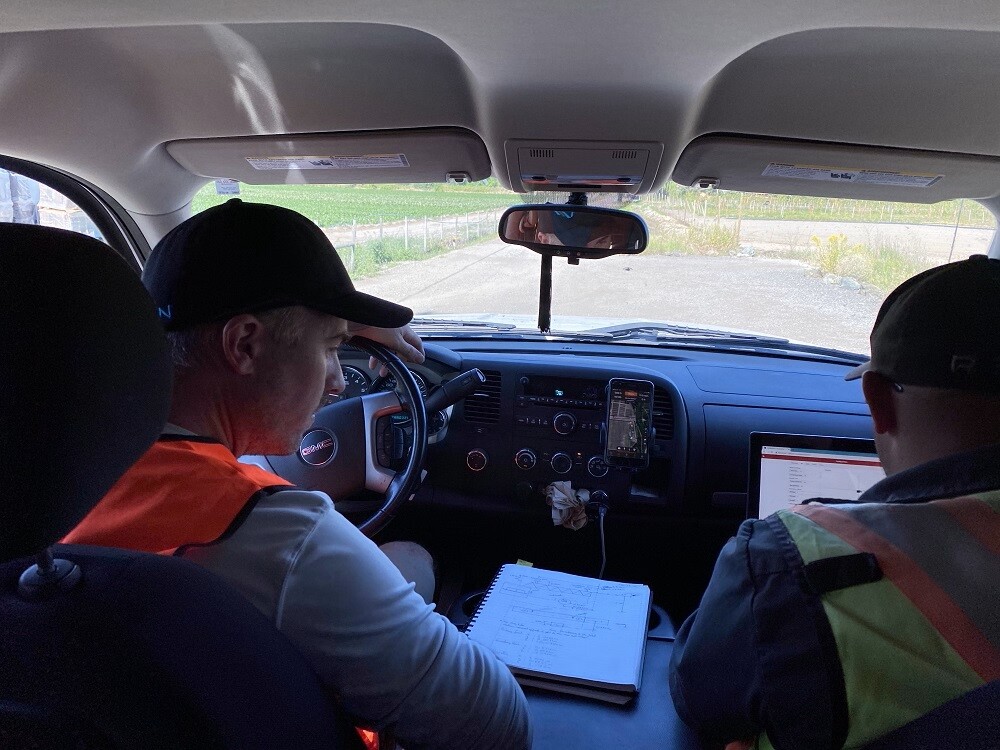
Quality control was important to ensure the right data was collected and that it was of good quality. During the powerline mapping survey, the lidar scanner, INS and GNSS within the system were constantly monitored from inside the truck using Routescene’s QA Monitor software. QA Monitor is a Quality Assurance tool which allows the user to verify the range and quality of position (GNSS) and orientation (INS) of the system and to check for any outages in real-time during the survey. The operators can react immediately if there are any outages and abort the flight to remedy the problem, thereby not wasting time collecting data which is no good.
At the end of the survey, the data was also checked using Routescene’s LidarViewer software. LidarViewer is predominantly used to verify the quality and coverage of the lidar scanner and ensure sufficient information is being collected. In LidarViewer, users can check their georeferenced point cloud, which prevents repeat visits to sites and delays to projects. As a result of this quality control only one pass through the neighborhood was required with the truck.
Accurate and high-resolution data to identify power lines
The lidar sensor within the Routescene mobile mapping system provides up to 1.4 million 3D points per second in dual return mode. 4.9km of road was covered with a total of 950,854,243 points processed. The average number of points per square meter was over 1,400 which provided incredibly detailed results. The vertical error was just 1.9cm.
Accuracy means the difference between the point cloud z value and a known ground control point. Using ground control, the point cloud is compared to ground targets with a known vertical height. By averaging the height difference between the point cloud and the targets, accuracy can be determined. The more points that hit the ground control target, the more confident one can be in the stated accuracy.
The lidar scanner incorporated into the Routescene lidar system captures 700,000 points per second. Setting the lidar sensor rotational speed to 5Hz provides a high point density on the road surface. Point density reduces with range and is especially high for data captured closest to the sensor. To achieve even denser data, the road is typically driven twice to achieve double the data density.

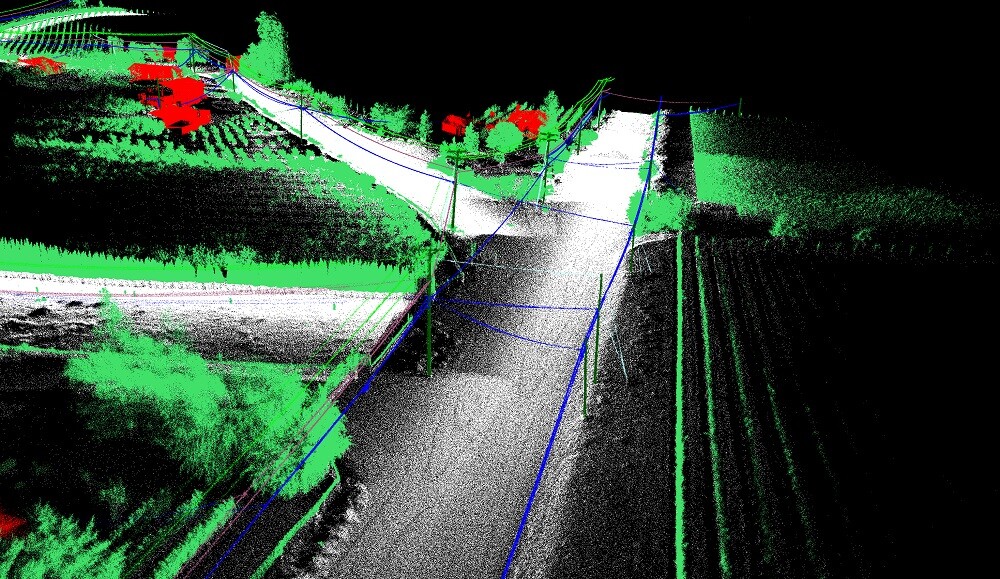
The high resolution data showed not only the roadways and surrounding features such as trees and telegraph poles but also the fine details such as road curbs and manhole covers. The team was able to identify electricity poles, guy ropes, the sag of electricity lines, electricity entry points into houses and many more useful features. Once classified in the point cloud, the features have to be modelled, for example a point cloud of a road curb needs to be turned into a polyline feature, this can then be extracted and exported into the required GIS software.
In this case, Rekon focused on classifying the items that would be useful for the client to plan the replacement of the power lines - the ground, structures / poles, anchor / guy wires, distributor conductor and overhead fiber optics. The following video shows the data looked in Routescene LidarViewer Pro processing software.