This summer we visited the New York City headquarters of Parsons Brinckerhoff Quade & Douglas, Inc. to understand how the noted engineering and infrastructure services firm uses 3D laser scan data in its civil infrastructure projects. We learned about best practices that PB has developed for applying existing-conditions data in design, construction, and communicating the look and feel of infrastructure projects to officials and the public. We also saw a demonstration of PB’s CAVE, a full-wall Computer Analysis and Visualization Environment.
Laser scanning a “renaissance in surveying”
Mike Williams, PB’s CIO, calls 3D laser scanning “a renaissance in surveying. It used to be that we’d survey all day, and get maybe tens of points. Today it’s just the opposite – an embarrassment of riches. In the last 20 years there’s been more change in field data acquisition technologies than in the prior 200 years.”
Where’s the payoff? It starts with visualization, says Williams. “It used to be that visualization was done ‘as computed.’ But now visualization is much more richly informed than before – it integrates ‘what’s going to be’ with ‘what is’ – firmly grounding the design vision in ‘what is.'”
The value of visualization lies in two areas, according to Williams. First, “if you can more effectively convey to a prospective client what value you bring – what you’re proposing, that you understand their requirements, what your approach is, what the project will look like on Day 1, Day 432, etc. – then you’ve got a much better chance of selling it.” He notes this also “enables more effective management of community expectations – ‘here’s what you can expect to see at various points in time.'” The second main benefit is that, during execution, better informed visualization helps manage construction sequencing, documentation and the like.
One person at the center of PB’s laser scanning activities is Dr. Rachel Arulraj, senior professional associate and supervising engineer in PB’s geotechnical and tunneling group. Another who shared his expertise with us is George Moglia, Jr., P.E., vice president and manager of civil design.
“We consider laser scanning a great tool to help speed up work in the field, improve accuracy, and also provide good bang for the buck,” Arulraj reports. “We use it for design, constructability, scheduling, estimating and, most important, for communication. We have to provide a finished picture or animation to the public stakeholders making the decision on whether we build this bridge or tunnel or roadway.”
Before PB adopted laser scanning, in order to carry out the visualization stage of a project “we had to do something like three times as much work to model the scene from 2D CAD drawings. Or if we needed to collect accurate as-built 3D data points, we typically didn’t have the thousands or millions of points necessary to adequately represent the project. We see a three- to fourfold improvement in the time it takes us to model now that we have laser scanning.” In sum, “laser scanning allows us to quickly provide cost-effective solutions with engineering levels of accuracy.”
“At PB we’ve been using laser scanning for about four years,” she says, “and we’ve used 3D modeling and visualization for 10 to 15 years.” She adds, “The best way to communicate is a 3D or 4D model.”
3D infrastructure visualization
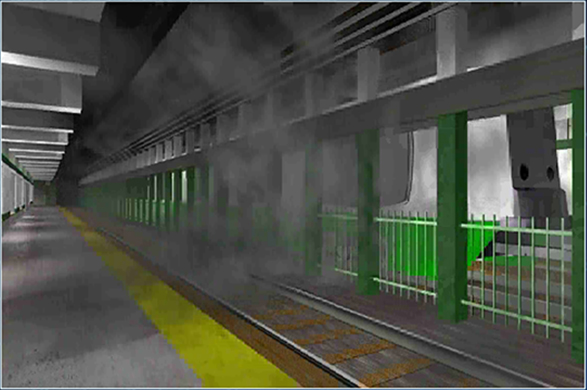
What kinds of projects have benefited from PB’s application of laser scanning? “In an enclosed facility project, we used CFD to model how best to engineer smoke removal in the event of a fire – where to close off walls, where to place vent fans,” Arulraj says. “First we laser-scan the existing facility, then we use the data to model placement of the fan plant. We need a very accurate 3D model because of the congestion – support beams, girders and other elements that obstruct and affect airflow. And we used the CAVE to visualize smoke removal and to verify effectiveness of venting design.”
Figure 1 is taken from “a simulation of how the smoke is going to be pulled out by the vent fan” in the event of a fire. “The design engineers planning the vent fan locations will use this 3D model – either 3D CAD files, or else the point cloud data – so they can decide whether they should build walls. You can see there are open areas, and the fan plant may not be strong enough to pull out all the smoke in an emergency. Engineers design the fan plant capacity based on mathematical calculations of the volume it can cover. But if this 3D simulation shows that to be insufficient, they may build walls [to direct smoke flow].” Here’s where the precision of laser scan data is critical: “When they build walls, there may be only a few inches of clearance. And they may not be able to build walls in some places” – confined space facilities should always allow enough room “for humans to save themselves. Prior to laser scanning, we walked through confined facilities to confirm the safety of the crew before deploying them in such facilities.”
Another example is infrastructure rehabilitation projects where “we need to model human clearances. That again requires precise 3D data.”
Also, “we use laser scanning to estimate material removals, for example earth removal, and bulk quantities. With laser scanning, we can tell the contractor how much earth to remove, and we can make sure the project does not go over budget on that. And that means X amount of concrete has to be ordered and poured in.” With this, Arulraj affirmed something we have heard time and again about laser scanning: “It has empowered us engineers to plan for construction more objectively.”
Arulraj described another use of laser scan-derived 3D models. “We take the 3D data, then use another software application to provide models that are easily understood by the fire ‘first responders’ who have to go to a site and locate themselves. We get the 3D model, then we can texture-map it and add more detail for people who have no spatial background. This helps first responders who need to get an understanding of the facility and their work in times of emergency.”
High-level-of-detail as-builts
“Here’s an example of very high-density data,” Arulraj says of Figure 3. “It was extremely good for us, because in this application we were trying to locate all kinds of conduits, which may not be visible. We had a challenge of going through some surfaces – the top of the rail for example may not be visible. Inside the tunnel everything is just different shades of gray. So it wouldn’t make sense to take a digital photograph. We tried that, but it wasn’t very useful.”
“With laser scanning, we can create high-level-of-detail as-builts of facilities in our CAD system much faster than with traditional surveying,” Arulraj reports. “Once we discern that the scan is of a column of a certain kind, we select that column from our CAD system library, drop it into the model and size it to match the point cloud. Ditto for light bulbs, conduit bundles, tunnel arch walls, track trough, track features, steel beams, etc., etc. – we know what the objects are supposed to look like based on standards. We create the library for one project, and can often use the same library elements in other projects.”
“The next example [Figure 4] shows how we have taken the same tunnel and created a photorealistic model of it,” she continues. “Having to build this model from 2D as-built data would have been very time-consuming. But having the 3D data, it was very quick. What you see here is a product created in just a few hours.”
“Normally, when we build a model, we also texture-map the object. In this figure you can see we made the gray facility appear colorful to identify specific objects for the end user. This same data will be used for planning,” she adds, “so one data set serves multiple uses.”
Work process evolution: from visual rendering to 3D modeling
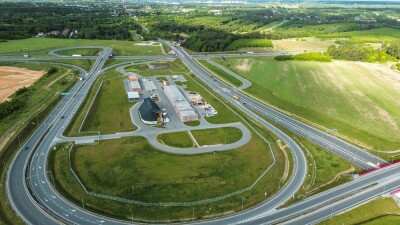
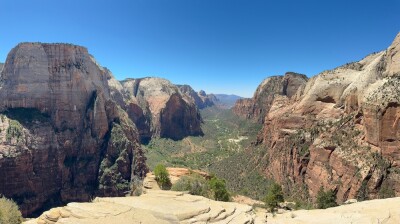
PB’s Moglia picks up the story, describing “how we got where we are today in producing graphics for our projects.” A decade ago, common visualization practice at PB was to take a digital photograph of the existing scene and drop in imagery to illustrate the proposed modification. Today, the work process involves CAD applications and detailed 3D existing-conditions data. “We start with an existing photograph of a roadway section that’s going to be in the new bridge location [Figures 5-7].” Detailed existing-conditions data is used to create a digital terrain model, “then we model in the bridge. In this case, the bridge shown was modeled using Photoshop.”
Laser scanning’s impact starts early, in the public-approval phase of projects. The impact of 3D deliverables is especially strong in “public information meetings and showings to elected officials and high-level staff in government agencies,” Moglia reports, noting that this makes project information much more accessible to officials and senior government-agency managers without engineering or survey backgrounds.
“Compare this with the way we created photo-simulations ten years ago,” says Moglia. “You’d take a photograph, then simulate the new condition using Photoshop. You’d have an image that took 40 hours to create, and it was nothing more than a pretty picture.” The beauty of laser scanning-based work processes, he says, “is that it’s not just a pretty picture – you can engineer off these drawings.”
4D constructability modeling
Arulraj concluded by detailing PB’s work in “4D modeling” for constructability analysis and optimization. This approach “is very new, but it is a great tool for anyone who is a project manager.” The concept is to use a project management and scheduling software tool in conjunction with 2D and 3D engineering data. “We model the 3D objects [involved in the project]. We also have 2D plans which the clients give us or which we create from the 3D models” to hand off to the construction contractor. Then “we tie it all to the schedule – each object is tied to a line item or a record in your schedule.” She showed an animation in which, as the date and schedule roll forward, the 3D model updates to show the planned progress of the project. “You can see the schedule keep changing as the objects show up and move into place.”
Figure 12 shows “an example of how we used 4D modeling for traffic routing during construction. Before we did this modeling, we had to go and find out what the existing conditions were. In such situations we laser-scan if budget permits, we build the 3D model, then we add the new elements on top of the existing conditions to show what’s going to change – how is this facility going to look in the future?” But at the same time, traffic engineers, design engineers and others had to figure out how to execute the project without stopping traffic. Using 4D modeling, the team discovers how to erect new steel frame and pour concrete on the roof while maintaining traffic. Figure 12 shows “a 2D plot of something that is really a 3D facility,” Arulraj notes.
“In our PB CAVE environment, we have pen tables where we can make marks and comments,” Arulraj reports. Figure 13 shows how this works when “people are deciding, ‘How should we design the foundation? What’s the lateral load?’ And so on. These discussions are captured in digital form and it can be shared across the country or the world through the Internet.”
Another benefit is that, “if we have the baseline schedule, we can go in and compare it with the actual schedule. Why is that important? If you’re building in a busy metropolis, we need to figure out when is the most appropriate time to bring in a crane, for instance.You have to do a lot of planning with regard to traffic, what roadway to take, how long it will have to sit in this facility to do whatever it’s needed for.”
“4D modeling is very useful for constructability scheduling,” says Arulraj. Further, “I think we could not have gotten to this stage without a good 3D base. That’s where I see the true value of laser scanning.”
“There’s a lot of opportunity out there, and we’re in a great time period with regard to laser scanning,” Arulraj sums up. “I’ve not lost any of the excitement over the four to five years I’ve been involved with this technology. In fact I would not call it an ’emerging’ technology any more – today I would call it evolving.”