
For decades, urban revitalization has been plagued by a fundamental problem: decisions are often made with incomplete information by people far removed from the communities they affect. This can mean that vacant lots go untracked, unsafe properties linger, and resources aren’t always deployed where they’re needed most. The result is a cycle of well-intentioned initiatives that fail to make real impact.
The city of Philadelphia is attempting to prove that GIS technology can break this cycle, and the early results suggest they may be right.
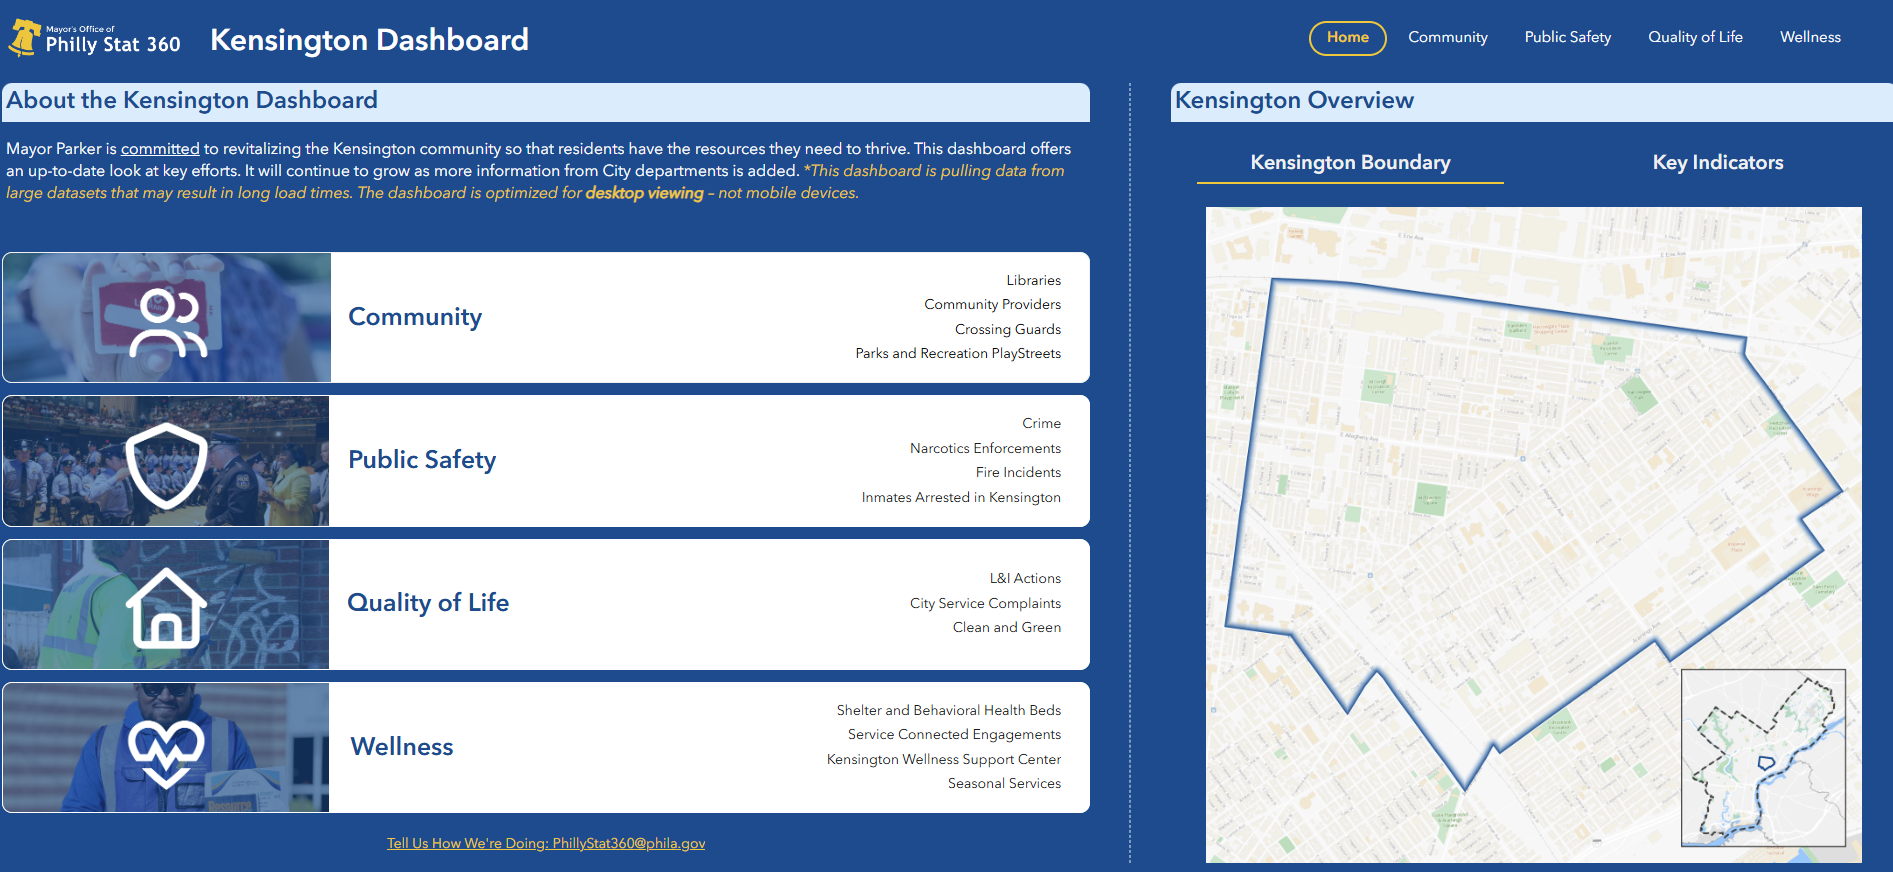
Earlier this month, the city unveiled the Kensington Dashboard, a real-time, publicly accessible tool built on Esri's ArcGIS platform. The map works as a live data infrastructure that puts decision-makers, residents, community advocates, and developers on the same informational footing, in real time.
The Power of a Single Source of Data
Many professionals who have worked in urban planning or municipal GIS have expressed trouble with siloed data. For example, public safety metrics live in one department while housing vacancy data in another - code violations somewhere else entirely. The result is that often no individual person has a complete picture, and coordination between different departments becomes a game of telephone.
The Kensington Dashboard consolidates 30 metrics across four domains - community resources, public safety, quality of life, and wellness - into one interactive experience. Users can filter by timeframe, click into specific locations, and watch visualizations update dynamically. For the GIS community, the architecture is as notable as the output: this is what it looks like when a city commits to breaking down data silos at the platform level rather than the project level.
Ground Data at Scale
What makes Philadelphia's approach particularly instructive is how the dashboard came to be. The city didn't simply digitize existing records. It conducted a comprehensive citywide land survey to surface previously unknown conditions - vacant lots suitable for multi-family housing, properties used for illegal dumping or drug activity, gaps in public safety services, and community assets that could anchor neighborhood recovery.
That ground-level data collection, fused with community feedback and layered into ArcGIS, is what transforms this from a reporting tool into a planning tool. It's the difference between a map that describes a neighborhood and one that actively guides investment in it.
A Replicable Model
Philadelphia's effort is launching first in Kensington, a neighborhood that has faced intersecting challenges around vacancy, public safety, and economic disinvestment for years. However, the city's goal is citywide impact: 30,000 affordable housing units, guided in part by the intelligence this platform generates.
The technology itself is not new. ArcGIS is widely deployed across municipal governments. What's new is the intention and decision to build a public-facing, continuously updated tool that gives every stakeholder access to the same data layer, rather than keeping that intelligence inside city hall.
The GIS and geospatial industry has long argued that location intelligence can drive better civic outcomes. Philadelphia is putting that proposition to the test in one of America's most complex urban environments.
The question for other cities isn't whether they have the technology, most already do. The question is whether they have the political will and the data governance to deploy it in a similar way. A dashboard is only as powerful as the institutional commitment behind it and right now, Philadelphia seems to have both.
For the geospatial industry, this is a moment to watch. And, perhaps, a blueprint to help replicate.