Last week’s SparView explored the safety, cost, speed and accuracy benefits of 3D laser scanning for evaluating rock faces – critical information needed to design tunnels, slopes, bridge and dam foundations, and underground and surface mines. This week we look at post-processing workflows and preparing deliverables for engineering and analysis, as presented by Dr. John Kemeny, Department of Mining and Geological Engineering, University of Arizona, Tucson, at the Transportation Research Board 5th International Visualization in Transportation Symposium and Workshop, Denver, CO.
Continued
Post-processing workflow
Registration – The first step in post-processing rock face data is to orient the point cloud to the real-world coordinate system based on data captured in the field. A commonly used method is to register the point cloud based on three targets of known position. But for some applications such as slope stability, only the orientation registration is required. In these cases simpler methods will suffice, such as only measuring the orientation of the scanner, without any position surveying.
Mesh generation – The second step is generally creation of a triangulated mesh, and filtering extraneous data points.
Automatic fracture delineation – The most important step in processing, Kemeny notes, is delineating fracture “patches” in the triangulated mesh. He notes the term “patch” is used rather than “fracture,” because a single large fracture may be delineated into several smaller patches depending on the flatness and roughness of the fracture. Fractures are detected by using their basic property of flatness. Post-processing software for geotechnical applications can often find flat surfaces in the triangulated mesh automatically – it first calculates the normal to each triangle, then finds groups of adjacent triangles that satisfy a flatness criterion set by the user. (See Figure 3 – Image on right shows patches that were found in the point cloud, using the criterion that a patch must be at least five triangles, and neighboring triangles in a patch must not deviate in orientation by more than 10 degrees. Patches are outlined in green; holes in patches are outlined in red.)
Stereonet plotting – Once the patches have been found, their average orientations can be plotted on a stereonet (see Figure 3). Each patch is plotted as one point on the stereonet; point size can be adjusted based on parameters such as patch area or roughness. Kemeny’s research indicates that large patches are a good indication of important fractures and fracture sets; small patches may not actually be fractures but only small surface areas that happen to be flat. Thus, he says, a useful technique is to weight the points by area, and plot the smallest fractures as only a small dot. At this point, fracture sets can be defined and the statistical properties of each set can be calculated. This data can also be exported to software for calculating slope stability or underground stability.
Continued
Laser scanning vs. traditional methods
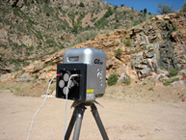
Kemeny describes laser scanning a highway slope in Mt. Lemmon, AZ. (Figure 4). A single 15-minute scan captured 1.2 million points. No survey control was needed; point cloud registration was performed by measuring the orientation of the scanner. With manual methods, this job would have required four hours in the field and one hour of data entry and plotting. With laser scanning, field time was reduced to less than one hour; post-processing took one hour. Further, laser scanning gathered a much more complete dataset than was feasible with manual measurement (Figure 5).
A particularly useful capability with laser scanning is the interaction possible between the stereonet and the point cloud, Kemeny notes. Delineating joint sets from stereonet data is difficult and requires professional expertise. Conventional practice is for data to be captured in the field, then delineation of joint sets to be done later in the office. Difficulties in interpreting the data can necessitate additional field work. But laser scanning can eliminate the need for return field visits – the user can go back and forth between the stereonet and the point cloud to determine with high precision the delineation of important fractures and fracture sets.
Presentations by Dr. John Kemeny and others will be featured in a geotechnical track at SPAR 2007: Capturing and Documenting Existing-Conditions Data for Design, Construction and Operations, March 26-27, Houston, TX.