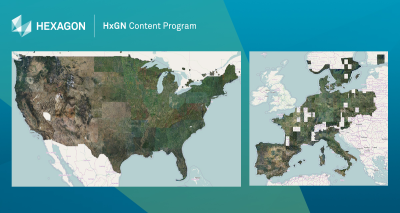
The buzzword ‘democratize’ gets thrown around a lot in technology publications, but the HxGN Content Program from Hexagon is the rare example that fits the definition. The program has helped to bring aerial data that was previously inaccessible or prohibitively expensive to a format that is open to anyone and can be tailored for individual needs. Since its inception in 2014, the content program has amassed imagery in wide and urban areas at high resolution and with a frequency and cadence that is useful for broad applications.
 In the last few years, the Hexagon program has expanded, with high-resolution data being added for major cities and with areas switching from 30- to 15-centimeter resolution.
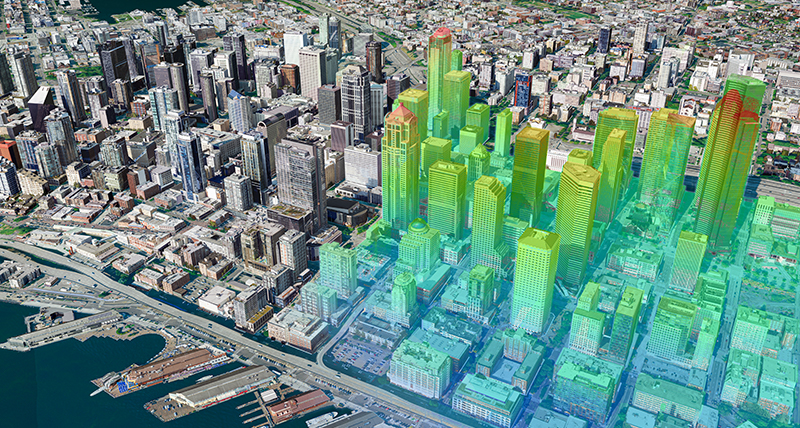
More recently, the Metro HD program has sought to capture, model and visualize urban landscapes with high-definition digital twins of global cities. Capturing cities with the Leica CityMapper hybrid mapping sensor, the combination of lidar and improved cameras has brought the data available to new levels of positional accuracy. The launch of the cloud-based storage, visualization and collaboration platform HxDR will bring these tools to even broader audiences via its marketplace.
So, what is the world doing with that data, and how did the program come to make such a mark on the geospatial industry? To put the evolution and importance of these developments into context, we spoke with John Welter, President, Geospatial Content Solutions, at Hexagon’s Geosystems division.
How did the Hexagon Content program originate, and how has it evolved?
The original idea behind this program was to bring professional quality data to everyone. Doing a lot of jobs in the US and Canadian market, we found that there were quite a number of situations where we would see areas being captured in duplicate.
We would be capturing an area in Ohio and then, a month later, somebody else would fly the same area for a different customer. That’s when the light bulb went off – hey, this isn’t efficient. How do we work better and make one set of authoritative data that is available to everybody?
The idea was to start collecting large areas and market those through the program. This way, we could reduce the smaller ad hoc projects everywhere – if you want Ohio, you just get it from this database, and the more people buy the area the more often the product is refreshed.
This grew nicely in the USA, with the US government being a big anchor customer. As more customers joined the program, we started to get requests for 15-centimeter data. Last year several states were captured at 15-centimeters resolutions – so 15 is the new 30.
The other recent development was that AI started to come into play. If you think about geospatial, we have huge pools of data sitting around that could help solve interesting problems before they even occur. Before AI, it was expensive to invest in downstream data analysis, so it was reactive – after a problem emerged, research was done to address it. Whereas now, with AI, we are allowing algorithms to mine our latest data and discover emerging problems.
Can you share an example where that kind of intelligence made a difference?
When Hurricane Maria came through Puerto Rico and into the coastal areas, we had collected data only three months prior, and we made it accessible for free to all NGOs and government responders. We offered them a map showing the area before the storm and let them use it for their recovery work. It showed the power of collecting data on a cadence. In the past, the hurricane would come, and everybody would go out and capture data and have no view of how it was before. You could lose some of the nuances. The same was true for the COVID-19 pandemic and Hurricane Ida that went through Louisiana. We like to use the saying, “You can’t manage what you don’t measure”, so having the pre-condition is critical.
Read more about the HxGN Content program and COVID >>
Recently, more cities have been added to your dataset and some additional extra imagery, can you tell us more about how you chose those particular locations?
Usually, that’s a customer-driven decision, but some were chosen due to their complexity. We captured New York City because it’s a highlight and, from a US perspective, a very impressive skyline.It is also a very challenging area to map because of the high buildings, so it’s a great reference data set. The others, including Dallas, Texas, were customer-driven, as was Munich, Germany. In Texas, we flew the state at 15-centimeter, which covered their statewide need, but cities require data updated at a different schedule and resolution. So the Content+ program allows them to say, “hey, I’m happy getting all of Texas at 15 centimeters every three years, but I want Dallas, Fort Worth and Houston every year at 7.5-centimeter or 5-centimeter.” It offers an add-on, so that the state can manage the varying cadences and request what they need. We build that into our subscription price.

What are some of the use cases for some of these higher resolution and higher frequency products?
One of the most significant applications we are seeing right now is the 5G rollout. 5G is coming at us very quickly. Many people don’t realize that 5G is a line-of-sight technology, which means your phone has to ‘see’ the antenna, or you’re not going to get that 5G connection. So network providers have to build the line of sight into the places where most people spend their days – on highways, roads, parks, etc. Telecommunication companies need really good geospatial data to figure out the placement of the antennas. So 5G is a huge application for us right now.
The other big one is insurance. Putting people on roofs for assessments and inspections is dangerous. The same work can be done from the office by using good quality geospatial data rather than sending an inspector in a hazardous place.
City planners are starting to like these products a lot as well. People want to see not only where they will live but the green spaces and parks in the surroundings. This data can start to fulfill all these features and functionalities. In some ways, it’s almost like you’re there. The quality is almost what I would call a 'digital twin’ level. I know if I buy or rent this condo, I can see this park, but there is a firehouse over there, and maybe I want to factor in the noise. So these kinds of considerations become very important as people move around and lifestyles change.
The new CityMapper sensor was used to collect a lot of this more urban data. What kind of an impact has that platform had on the available imagery and data?
The Leica CityMapper was interesting because it really focused on a customer’s problem. We had a big customer in a certain part of the world come up to us and say, “Our city is growing so fast. It’s out of control; we need a better way to map it. And because of smog, tall buildings, vegetation and other obstructions, imaging alone doesn’t always see down to the ground, so we’re not getting accurate maps at the transportation level.” So we said that would be a good application for lidar, but they did not want to fly twice — once with imaging and once with lidar — so we took the two technologies and put them together into the first CityMapper.
We’ve just expanded on performance with the CityMapper-2. We now not only have the beautiful imagery that the new camera can capture, we can also ensure that even in shadows the accuracy is consistent because of the lidar technology.
If you look at the street level in the New York City example I mentioned earlier, the front of the building may not look perfect because it was collected from the air. But I guarantee you that it’s in the right place, which is the most important part. There is nothing lost, and the building footprints are all correct. All the features are in their proper place, which is unique to lidar — you can’t do that from imagery alone.

How does the Hexagon content program and CityMapper-2 fit into the context of the rest of what Hexagon is doing?
Hexagon envisions an autonomous future where business, industry and humanity sustainably thrive. Along with other parts of the business, we enable and run smart digital realities that support efficient, environmentally conscious and people-friendly decision making. HxDR will become an online marketplace for this rich 3D and 2D data. So not only do we have our specialty sales channels through Hexagon market segments, like the safety, infrastructure and geospatial division, we are making it available to everybody.
So that’s one step, but then we are focusing on new technologies to capture the insides of buildings, including the BLK ARC and the BLK2GO. My division is looking after the outside “citywide” view of the buildings, but there are people interested in what’s inside. So HxDR eventually will evolve to bring all these worlds together – we will truly have both the single digital twin of the outside and the inside, which unlocks various applications.