
Every morning, thousands of construction workers step onto jobsites carrying little more than their tools, their training, and the trust that someone has done the work to make the ground beneath their feet as safe as possible. For decades, that work relied on paper blueprints, prior knowledge, and the hard-won experience of veteran superintendents. Today, GIS is doing much of that work invisibly and the results are saving lives.
GIS is, at its core, a platform for understanding the world spatially. Urban planners have used it for decades to map zoning and infrastructure. Emergency responders use it to route resources during disasters. And now, the construction industry has discovered that layering jobsite data like soil conditions, utility corridors, worker locations, weather patterns onto a live geographic map gives project teams a level of situational awareness that no blueprint or spreadsheet ever could.
The Danger Beneath the Surface
There is perhaps no more invisible danger on a construction site than what lies underground. Gas lines, electrical conduits, water mains, fiber optic cables make up a complex web of utilities run beneath virtually every jobsite in the country. Striking one of those lines is not merely an inconvenience, it can be deadly. Explosions, electrocutions, and flooding have all resulted from accidental utility strikes, and they remain one of the leading causes of construction fatalities each year. GIS has fundamentally changed how crews approach this risk. By integrating utility records, municipal databases, and ground-penetrating radar data into a single spatial platform, project teams can visualize exactly what lies beneath the surface before a single shovel breaks ground.
The power of this technology was demonstrated at scale during the construction of London's Crossrail project, now known as the Elizabeth Line, one of the most complex infrastructure undertakings in European history. Tunneling beneath central London meant navigating more than a thousand miles of underground utilities packed into one of the densest urban environments on earth. Through meticulous GIS-based utility mapping, engineers were able to visualize conflicting infrastructure corridors in three dimensions, planning excavation routes that avoided dangerous conflicts. The project completed its entire tunneling phase without a single major utility strike incident, a feat that would have been unthinkable a generation ago.
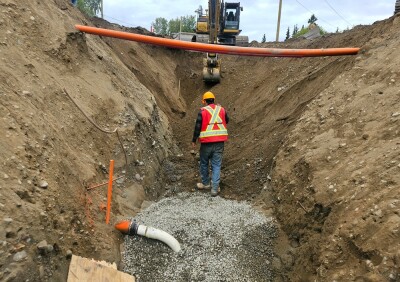
Reading the Ground Before It Gives Way
The earth beneath a construction site is not static. Rain saturates soil, excavation changes the load distribution on nearby embankments, and fault lines and historical ground disturbance create invisible weak points that can collapse without warning. Trench cave-ins and slope failures are among the most deadly events in civil construction, and they are also among the most preventable if crews have the right information.
GIS makes that information available by integrating lidar elevation data, soil survey records, and historical rainfall data into predictive models of slope and ground stability. In California, where the terrain ranges from coastal cliffs to mountain passes, the California Department of Transportation, Caltrans, relies on GIS-based slope stability mapping as a standard part of its highway construction process. Before crews begin widening a mountain road or constructing a retaining wall along the Sierra Nevada, GIS models identify sections where saturated soil, proximity to fault lines, or steep gradients create elevated collapse risk. Engineers can then redesign approaches, reinforce problem areas in advance, or schedule high-risk work outside of the rainy season. The ground still holds its secrets, but GIS has made it far harder for those secrets to be deadly ones.
Finding Workers When Every Second Counts
When something goes wrong on a construction site, say a fire breaks out, a gas line ruptures, a worker goes down from heat stroke, the difference between life and death is often measured in minutes. In those minutes, one of the most critical questions is simple: where is everyone?
On a large site with hundreds of workers spread across multiple active zones, answering that question without technology can take agonizing amounts of time. GIS-integrated personnel tracking systems answer it instantly. During the construction of Hudson Yards in New York City, the largest private real estate development in American history, the project team deployed exactly this kind of system. Live maps of worker locations were available to incident commanders at any moment, updated in real time through GPS-enabled badges and equipment transponders. During the project's years of construction, that system was activated during multiple fire alarm events, enabling rapid accountability checks and targeted evacuation routing across simultaneously active work zones. Workers were accounted for faster, emergency responders were better directed, and the chaos that can cost lives in the critical first minutes of an emergency was significantly reduced.
Watching the Sky So Workers Don't Have To
Construction work is relentlessly exposed to the elements. Ironworkers on open structural steel have no shelter from lightning. Crane operators lifting thousands of pounds of materials are acutely vulnerable to high winds. Excavation crews working in low-lying areas can find their trenches flooded in minutes during a flash storm. Weather has always been a construction hazard, but historically, crews relied on general forecasts that are designed for the public, not for the precise, location-specific needs of a jobsite.
GIS has changed that by streaming live meteorological data directly into the same platform that manages jobsite operations. Turner Construction, one of the largest general contractors in the United States, has integrated GIS-based weather monitoring across its project portfolio. On high-rise projects in cities like Chicago and Miami where weather can shift rapidly and wind conditions at elevation differ dramatically from conditions at ground level, site superintendents now receive automated alerts the moment wind speeds approach operational thresholds for tower cranes. Crews have time to secure loads and suspend lifts before conditions become dangerous, rather than reacting to a gust that has already arrived. It is a subtle shift, but in an industry where the margin between a close call and a tragedy is often measured in seconds, advance warning is everything.
Learning from Where Incidents Happen
There is a kind of knowledge that only accumulates over time, through the painful recording of near-misses and injuries, through the discipline of asking not just what happened but where it happened. For most of construction history, that knowledge lived in incident reports that don’t provide the geographic context that could reveal patterns invisible to the naked eye.
GIS restores that context. By plotting the location, time, and type of every near-miss and incident on a project map, safety managers can see clusters and corridors of risk that no spreadsheet would ever surface. Skanska, the global construction and engineering company, has applied this approach across its U.S. project portfolio with striking results. On one large transit infrastructure project, GIS-based incident mapping revealed something that months of tabular reporting had missed entirely: a disproportionate number of slip-and-fall incidents were clustering in a single access corridor, consistently occurring during early morning shifts. The data pointed directly to the problem: inadequate lighting and an untreated surface in a high-traffic area at the hour when conditions were worst. Targeted interventions followed for better lighting, surface treatment, revised worker routing, and the incident rate in that corridor dropped sharply. The workers who walk that corridor today have no idea how close they are to a data point that protected them.
What Comes Next
The story of GIS in construction safety is not finished. It is, if anything, accelerating. The integration of GIS with AI and smart wearable technology is already underway in pilot programs across Australia, South Korea, and the UAE, programs that envision a construction worker's vest feeding real-time biometric data into a GIS platform, with AI models flagging signs of heat stress or fatigue before a worker collapses. The goal is not surveillance for its own sake. It is the same goal that has driven every safety innovation in the industry's history: getting every worker home at the end of the day.
Construction is, and has always been, one of the most dangerous industries in the world. More than a thousand workers lose their lives on U.S. jobsites every year. Behind every one of those numbers is a person with a family, a crew that grieves, and a community that feels the absence. The tools that reduce that number deserve to be celebrated just as much as the structures those workers build. This National Construction Safety Week, GIS is one of those tools. Working quietly, invisibly, in layers of data and spatial maps, it is helping the industry build not just bigger, but safer.
Stay safe. Build smart. Happy National Construction Safety Week.