Golden, Colorado-based Golden Software has announced a new version of its “affordable scientific graphics software” called Surfer. The company says it has improved the core functionality of Surfer to help geospatial professionals, geologists, environmental consultants interpret complex scientific data.
The software is designed for 3D visualization and 3D mapping allows users to model data sets, apply advanced analytics, and communicate results graphically “in ways that anyone can understand.”
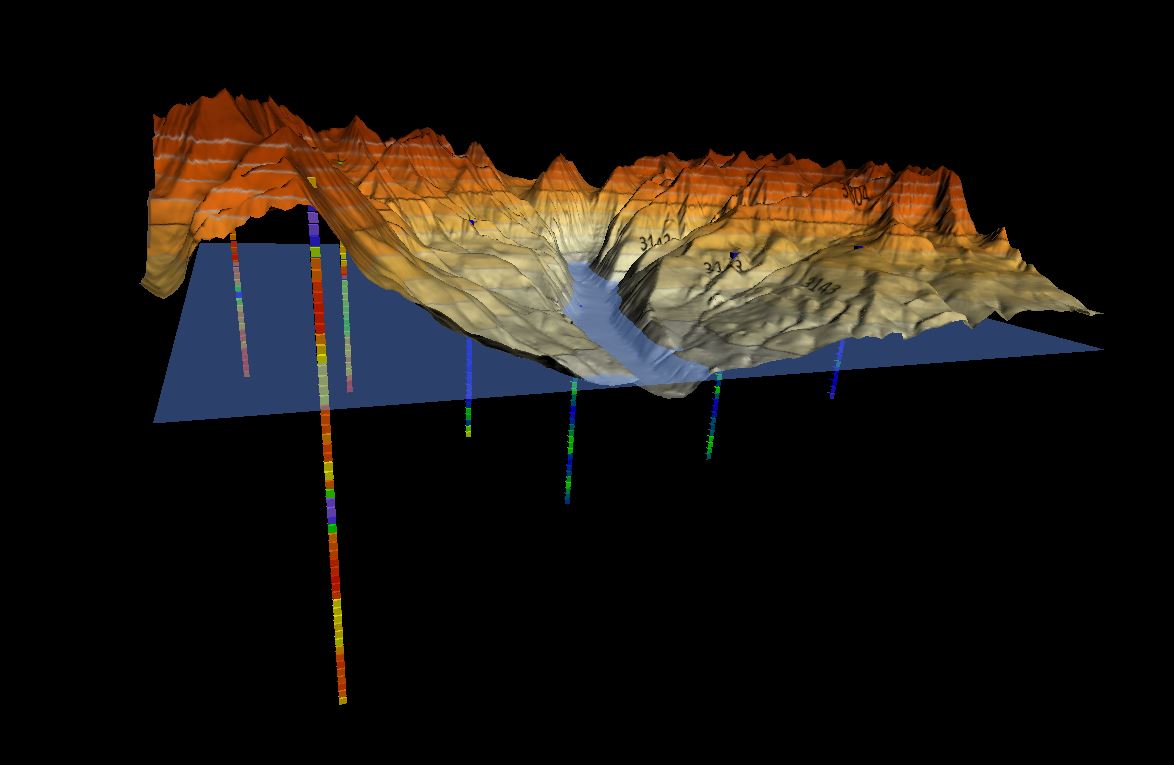
The new version includes a number of new features related to 3D data visualization, contour mapping, and color mapping. Golden has expanded Surfer’s support for point clouds so that any 3D vector data can be visualized in 3D View in full three dimensions. Golden says that clients who use this tool to visualize sub-surface wells can easily display the well path. The new feature can also be used to check the quality of 3D grids.
Surfer now includes commands for calculating geometry—such as area, or perimeter length—and adding those values to object attributes.
Equal Area Contouring lets users calculate the geographic distribution of contours to better align with the underlying geophysical data. Golden says this means more accurate visualization geospatial data sets, “which are seldom linearly distributed.”
The Equal Area Stretch feature lets users “stretch colors across the distribution of data” to create a “proportionate representation of the data variation and enhancing the visualization’s contrast.” Users can display tightly distributed data with quickly varying colors to better highlight data anomalies.
The new version of Surfer 16 also adds Kriging with external drift, which allows users to add a secondary data set “for use as a proxy in interpolating the primary data set with the goal of yielding better estimate values.”
For more information, see Golden Software’s site here.


