Now that we have accepted 3D capture as a necessary technology, we’ve moved on asking, How can we use it to its full potential? For Reconstruct, the answer is to make it the foundation of an “integrated visual environment for construction progress monitoring.”
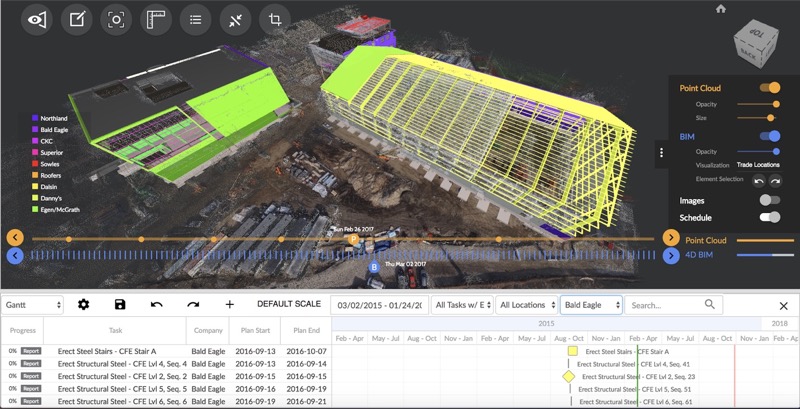
Quickly moving past the elevator pitch: The cloud-based platform generates 3D reality models and visualizes them within a 4D BIM (time/scheduling being the fourth dimension, naturally). By generating this mashup of modeling approaches, the platform is able to reach its final goal: measuring progress, productivity, and performing analysis to determine the risk for delays on complex construction projects.
I spoke to Keshav Sahoo, VP of product for Reconstruct, to learn how the different parts of the solution break down, and how the platform brings it all together.
Step 1: Crowd-source a 3D reality model
Sahoo tells me that Reconstruct is built on a proprietary reality modeling engine developed at the University of Illinois a few years back (and improved on since then). The engine is cloud-based and optimized for vertical structures. It also accepts a variety of data types, including 2D images, 360° photos, videos taken on your smartphone, consumer-grade camera, or camera drones.
The idea is to allow field workers—or automated capture platforms—to continuously “reconstruct” the model as work progresses. “This enables crowd-sourced reality capture,” Sahoo says, “where any trade can take pictures and videos using their smartphones or 360 cameras,” and the project can perform more precise scheduled capture using laser scanners and drones.
Step 2: Integrate it with 4D BIM
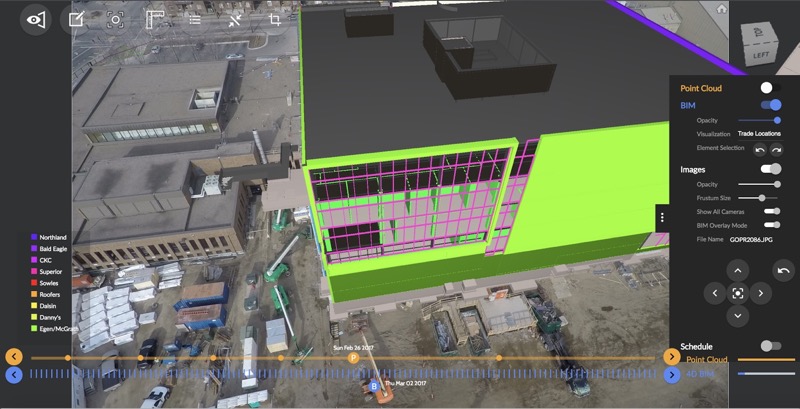
Once you have generated your initial model, upload your BIM (in one of 60 file formats) and your project schedule. Here, Reconstruct will provide semi-automated mapping of your data sets, which means it associates BIM elements to scheduled tasks and requires only that the user check the work.
Next, Reconstruct aligns your 3D point clouds and 2D site images to the BIM using a combination of computer vision techniques and location data. If your images and BIM include GPS, the initial alignment is fully automatic (ground control points will also help). However—and this is good news—GPS and GCPs aren’t necessary. In these cases, Sahoo says, simply use the alignment tool to get everything properly lined up.
After the initial alignment, whether it was fully automatic or partially manual, everything stays aligned for the rest of the project. That includes new BIMs and new 3D reality models. That means when a trade finishes working in a location in a building, and uploads some imagery and 3D data, the system will automatically align it to the rest of the model.
The final result of this process is that the “three aspects,” (3D reality model, BIM, and schedule) are aligned, providing a 4D visual environment where any user can intuitively access a variety of information about the project.
Step 3: View your data, access predictive analytics
But that’s only half the story. You can extract a limited amount of insight simply by looking at all your information laid out in four dimensions. That’s why, Sahoo tells me, Reconstruct compares your 3D models and images to the 4D BIM as a means for reporting on physical progress. If you input crew size information, it can also provide productivity reports for work packages.
Perhaps more far-reaching, however, is Reconstruct’s data analytics engine, which crunches the numbers to gauge construction performance over the project timeline and automatically identify risk for potential delays. The system color-codes the progress using intuitive stop light colors to indicate work packages that are on time or behind schedule.
“In our advanced mode,” he says, “we can also communicate whether the task has started late, whether it exhibits a critical delay,” and a number of other signs.
To recap: Reconstruct mashes your data together to give you an especially rich view of your project. If you want to know what’s going on in a defined area of the second floor, “Zone A” for instance, you can filter for that location and learn a lot in short order. Sahoo lists out a few possibilities:
- who is doing what work in that location, on a daily basis
- how much work is complete per work package
- how much work is left per work package
- quantity take off per work package
- the flow of work among trades in that location
“By clicking on a location,” Sahoo says, “users can also get access to the most relevant images of that location, can analyze them over the project timeline, and annotate them for job site issues and field reports.”
 Step 4: Update as necessary
It’s worth nothing that the system does not limit you to one 3D model, one moment in time, one schedule, or one BIM.
Update the model, the BIM, or the schedule, and the system will reprocess automatically. Select a new BIM date from the project timeline, and the system will show you “what work will happen that day, the locations where subs and trades are expected to be working, progress status of all ongoing tasks, and risk for potential delay across all relevant work locations. Search by location, search by date, search by trade names, and find what you need.
And this is just the start, really—the system offers impressive data interoperability, and a number of analysis and visualization modes we don’t have the space or time to dig into, as well as a number of methods for reporting that help facilitate on-site coordination meetings.
Reconstruct takes a fundamental technology, 3D capture, and pushes it hard to reach its full potential for AEC users.
For more information, see the Reconstruct website.