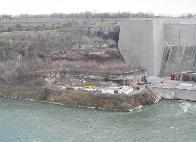
The Robert Moses Niagara Power Plant is part of the Niagara Power Project sited on the lower Niagara River at Lewiston, NY. The New York Power Authority, which owns and operates the facility, determined the rock slope adjacent to the plant’s north abutment required stabilization to
stop loose rock from falling onto the work deck of the dam, endangering workers and causing spalling of the structure. To plan a remedy, the Power Authority needed a topographic survey and mapping of the slope. But traditional survey methods would expose workers to the risks of falling rock and hazardous terrain.
Seeking a solution, the Power Authority engaged TVGA Consultants. The two organizations evaluated conventional survey techniques, reflectorless total stations and photogrammetry, but none satisfied the project’s safety or schedule requirements. TVGA then proposed was carried out on August 5, 2003 by TVGA and Northway-Photomap, Inc. using the ILRIS-3D from Optech Incorporated. In addition to letting field personnel avoid hazardous work areas, TVGA and the Power
Authority report that using laser scanning instead of total stations halved the price and slashed field time from two weeks to two days.
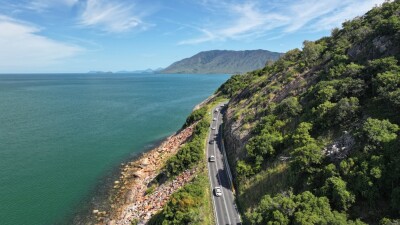
Unstable slope and risk of falling rock made it unsafe for field crews to move through the project site
“The sides of the Niagara gorge are unstable, with big chunks of shale falling off,” reports John Wingfield, manager of surveying, mapping and GIS with the Power Authority. “Because of that, it was necessary to survey the rock face and, using that survey, design measures that would mitigate the danger of falling rock – a combination of removing some areas and, for the most part, adding catchment fencing anchored in rock.”
The south slope had been surveyed by TVGA using traditional methods and stabilized several years before, but Wingfield describes how the north slope presented added difficulties. “The south slope is transected by our access road, so access was not as much of an issue as on the north side. But even so, TVGA had quite a bit of difficulty getting to the south slope. The survey was done with conventional means, but not without a great deal of effort and some safety concern for the people
involved.” By contrast, Wingfield reports, “on the north slope there is no transecting road and the rock face is more nearly vertical, so it would have been more unsafe to provide the level of detail required using total stations.”
Conventional survey techniques were deemed unsafe
“The challenge,” reports Roman H. Figler III, P.L.S., vice president and chief surveyor with TVGA, “was to determine the best way to acquire accurate data necessary to prepare the design and eventual construction drawings.” Conventional survey techniques were ruled out due to site safety concerns. Because of instability of the slope and risk of falling rock in the work area, says Figler, “It was not safe or feasible to allow field personnel to move throughout the project site.”
Reflectorless total stations were also considered, but ruled out due to the limited range capabilities of the equipment and site access considerations. “One limitation was the vertical height of the rock face, and limited access to points where we could set up instruments to view the instability of the surface. Putting a worker out there would have required tie-offs and other health and safety measures that would have been too time- and labor-intensive. Alternately, if we had tried to use
reflectorless total stations from the other side of the gorge, the distance would have been beyond the instrument’s range.”
Photogrammetry was rejected due to schedule pressure and ground cover
Photogrammetric mapping was also looked at, but eliminated because of both time and coverage issues. “The Power Authority was looking for a quick turnaround,” Figler reports. “The chief advantage of laser scanning over photogrammetry was time frame. A constraint with photogrammetry is waiting for a day when flying conditions are appropriate, when there’s no cloud cover. Another major concern was flying along the U.S./Canada border. We would have had to coordinate with a number of authorities, and it’s not always guaranteed that you’ll be allowed to fly in that area on the day you want to. Not to mention that it’s a fly zone for tourist helicopters that routinely travel up and down the gorge.”
Another strike against photogrammetry was that ground vegetation and brush along the gorge walls obscured a majority of the slope, and overhanging rock cast shadows. “But with the laser scanner, we could extract out the vegetation” from the captured data, Figler reports, and shadows cast by overhang made no difference. “The Niagara gorge is a challenging environment for photogrammetry,” Wingfield adds. “It faces due north/south, and there are rock faces that don’t ever see the sun.”
After considering these options, Figler “suggested that the scanning device he had might be a solution,” Wingfield reports. “So we looked into it in more detail. He came to us with a spec and a cost proposal, and our engineering department said it was acceptable.”
Average 340-meter scan range made ILRIS-3D ideal for the job
At the time TVGA was finalizing the purchase of an ILRIS-3D laser imaging system from Optech, but would not receive the unit in time to meet the project schedule. Consequently TVGA contracted with Paul Francis, L.S., O.L.I.P. of Northway-Photomap, Inc., a provider of terrestrial lidar services based in Toronto, to utilize its ILRIS-3D scanner in the project.
The project scope was to undertake a topographic survey of a 600-foot section of the lower Niagara River gorge wall adjacent to the north abutment of the Robert Moses Niagara Power Plant. Survey limits were 325 feet vertically from the edge of water along the lower Niagara River up to the top of the gorge wall along the Robert Moses Parkway, and horizontally along a 600-foot section of the gorge wall starting at the north abutment of the dam and proceeding north.
Project deliverable was a 1″=20′ scale base map with 1-foot contour interval.
Figler reports that the ILRIS-3D’s long range capability was ideally suited to this job, where the average scan distance was approximately 340 meters.
Five scans, four locations, three hours
Figler reports that he and Francis of Northway-Photomap reviewed the proposed scope of services and determined that “because of the site access constraints with the close proximity to the water, limited sight distance due to the height of the gorge walls, and safety considerations, data acquisition would be from the Canadian side of the international Data acquisition with the ILRIS-3D was carried out on August 5, 2003. TVGA and Northway-Photomap personnel completed five individual scans from four different instrument locations to obtain the coverage necessary to generate a 3D surface model of the rock slope. Surface data was acquired using a spot spacing of between 50mm and 70 mm. In addition, higher-resolution scans (24mm spot spacing) were acquired for ten areas containing features needed for geo-referencing. Total scan time was approximately three hours, which included mobilization and setup time at the various instrument locations.
Individual point clouds acquired from the four different instrument locations were processed, edited and registered into a single data set using InnovMetric Software Inc.’s PolyWorks software. To reference the project data to the Power Authority’s existing geodetic control network, Northway-Photomap personnel identified, on digital photographs, features in the point cloud that required x,y,z values. TVGA field personnel occupying existing control stations and utilizing a reflectorless
total station acquired the x,y,z values of identified features.
PolyWorks used to remove ground clutter, create TIN and DTM surfaces, export to AutoCAD
The point-cloud data was edited in PolyWorks to remove features such as structures, fencing, trees and ground vegetation that was not required to generate the TIN and DTM surface for the final deliverables. Upon receipt of the x,y,z values, the point-cloud data was geo-referenced into the Power Authority’s control network. TIN and DTM surfaces were created in PolyWorks and exported to AutoCAD for final map preparation. Planimetric features contained within the project limits were also extracted from the point-cloud data and exported into the AutoCAD map files. Mapping deliverables were prepared using AutoCAD and Trimble’s TerraModel software.
“The deliverables we received were an AutoCAD 3D terrain model, and hardcopy plan, elevation and perspective views of that model,” according to Wingfield. “I looked them over to ensure that we had the area coverage that we were looking for, and that the data would be usable for our purposes. Then I turned them over to our engineering staff. They were very pleased with them. They used that data to design the wire-mesh placement and anchoring.”
Laser scanning half the price of total station survey
Total price to the client was $10,500, Figler reports. “To get the required coverage using total stations would have cost at least twice as much.” Health and safety requirements of putting workers on the slope would also have added to the cost.
Shorter turnaround time was another big plus. “With total stations, we would have had to spend about two weeks in the field, plus one week in the office. With laser scanning, total time in the field was two days – one day for ILRIS-3D data acquisition (actual scanning took three hours), and
one day for geo-referencing with total stations.”
“We got plenty of detail to generate the contours and develop complete 3D models to let the Authority’s engineers perform design studies of the height of the catchment,” Figler reports. “The Power Authority used it to do visualization of, say, if a rock detached itself at the top, what its
trajectory would be.”
Laser scanning “ended up being less expensive, far quicker in turnaround time, and the detail is superior to any other option,” Wingfield summed up. “While this was our first terrestrial lidar project,” he reports, “I’ve been open to remote sensing options for survey data for some time. I’d been involved in using ‘conventional’ lidar before this. The power authority and other entities I’ve been involved with have used lidar for modeling both terrain and our transmission line catenaries for a number of years now. I was familiar with lidar – both its limitations and its promise and advantages – so taking a lidar sensor and turning it on its side, if you will, seemed a natural extension to me.”
TVGA and Power Authority have continued with laser scanning
TVGA reports it has executed ten laser scanning projects over the last two years. A full-service engineering and surveying firm based in Elma, NY, TVGA includes a surveying and geospatial practice headed by Figler that “does everything from boundary surveys to hydrographic bathymetry.
We do a lot of coastal work for the U.S. Army Corps of Engineers. Our mapping group does everything from vector mapping up to digital orthophotography.”
“We now own the ILRIS-3D scanner,” Figler reports. “That’s the only laser scanning instrument we own. Optech has been extremely helpful and responsive. And we use InnovMetric software, which we purchased through Optech. That’s worked out great. The latest version of PolyWorks lets you maximize the amount of information you can extract from the point clouds. Now you can create polylines directly in PolyWorks and export them to the CAD package. In past versions, extracting details from the point cloud was more time-consuming, but now it’s much more automated.”
Wingfield reports the Power Authority has since employed laser scanning on at least one other project. “On the Forebay Bridge, which spans the Forebay intake in the Niagara Power Project, our engineering department had observed some concrete buckling in the structure over the years,” he explains. “We had done some low-level deformation surveys of that with TVGA and others over the years. Last year we had them use their laser scanner to set up a baseline for the entire structure.
They initially ran into some climatic issues – snow and ice – that they didn’t expect, but the work is now successfully complete, and I believe engineering is using that data to monitor the bridge.”