Trimble VX Makes Huge Impact for Subcontractors
Joe Betit, PLS, knows about versatility, and he knows how to pioneer scanning on a massive civil infrastructure project. As the survey manager for the $ 2.6 billion Phase 1 of the Dulles Corridor Metrorail Project, a 23-mile Metrorail extension going through Northern Virginia, Betit has applied an array of optical/3D scanning/digital imaging scanners on multiple phases of the massive undertaking that began in early 2008. The line, which will extend the Washington, DC Metrorail from Falls Church in Northern Virginia west through the high technology corridor of Virginia and on to Dulles International Airport. Phase 1 of this project is being carried out by Dulles Transit Partners, LLC, (DTP), a joint venture of Bechtel Infrastructure, Inc. and Washington Group International (now URS), for the Metropolitan Washington Airports Authority. Betit will oversee up to 11 survey field crews, and four Area Lead Surveyors for aerial structures, Civil, Monitoring & Control, NATM Tunnel and the Office Surveyor assigned to Automated Machine Control model design.
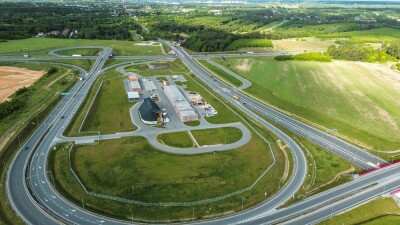
Scanning efforts on Phase 1 of the project began as a risk management-related focus for the underground utility relocation (UR) subcontract. Before jack-and-bore operations under Routes 7 and 123 could begin, surveyors needed to conduct risk management (pre-construction) surveys using laser scanning to document the surface condition of the road, adjoining parking areas and building infrastructure. The laser scanning point clouds and subsequently extracted 3D CADD entities were merged into a single CAD product to form an existing condition baseline. A 6,600-foot-long portion of the Metrorail line extension runs along Virginia Route 7, which is a heavily traveled corridor, and there was concern that jack-and-bore operations would affect the road surface.
“It was very clear [that]you simply couldn’t capture the level of vertical elevation points that they needed with traditional surveying,” Betit said. “The Route 7 corridor in this area is a complex section of road, including two three-lane roads, frontage roads, medians, parking lots and buildings and more which required a 250-foot scan path.”
Soon after members of the project began seeing the results produced by the scans and as-built data extraction of Route 7, scanning requests evolved into a plethora of other areas, including support of existing rail engineering design surveys (both for 3D CAD and supporting 4D modeling), pre-construction surveys (monitoring of complex walls and anything affected by construction vibration), road settlement monitoring and even existing sign management and cataloging. Scanning has also aided constructability studies to help confirm that train dynamic envelopes would clear obstacles such as bridge piers. Besides road surfaces, large segments of the pre-construction scanning has included the undersides and surfaces of bridges, elevated roadways and other similar civil infrastructure. Data is exported to Bentley MicroStation as 3D point clouds and 3D CAD entities as a digital deliverable and includes a point cloud viewer that is also capable of allowing the end user to make basic measurements.
Phase 1 of the project includes three miles of elevated, segmental bridge sections that will be cast in an off-site yard, transported by truck from the yard, lifted into position using a 300-foot span elevated truss and then post-tensioned; scanning will be used frequently to monitor or as-built the segment installation phases. Phase 1 also includes integrating laser scans and registered digital photography with multiple BIM-designed stations, eight miles of track construction produced by machine control and a New Austrian Tunneling Method (NATM) tunnel, which excavated a tunnel in small, sequential sections. Scanning has also produced 3D information on a very high, dry-laid Ernst and Young corporation signature terraced stone wall approximately 40 feet in overall height, as well as 23 50-foot wide swaths over the jack-and-bore road crossings of interest along Route 123.
“We’re going to integrate scanning wherever we can do it, cost-effectively, and where we can get multiple value-added products out of it,” Betit said.
One Tool of Choice: the Trimble VX Spatial Station
Phase 1 of the project, currently under construction, has utilized numerous subcontractors and equipment, including Dewberry, Optira, Terrametrix, Terrapoint, Riegl, Leica Geosystems HDS and Trimble. For the initial Route 7 and Route 123 road scanning, and the K-Line existing rail scanning, the Dewberry surveyors performed a high quality survey secondary control network densification to begin. This new control was based on the project Washington Metropolitan Area Transportation Authority (WMATA) Project Primary Survey Control (2001) provided by Don Falken, WMATA Chief Surveyor. The new secondary control was spaced approximately every 300 feet. Scanning distances had to be short because of the point cloud density requirements for road surface and top of rail modeling. “Initially, laser scanning for this project by Dewberry started out because of the DTP risk management subcontract requirements for utility relocation. Then we wanted high-accuracy 3D CAD models extracted from all of the scanned portions of the project, so we had to do an extensive control survey held to very tight tolerances,” Betit explained. The laser scan contractors did not use resection traverse methods (typical of the Trimble VX and GXA scanners); they targeted the project as with photogrammetry using multiple targets ahead and behind of the scan positions, and overlapped the scans. The Route 7 scans used a Riegl scanner with an integrated high-resolution digital camera. “We wanted the digital imagery registered to the laser scans because, despite the density of the scan point clouds, you really, in an image, can see far more about the true road surface condition than you can with just the laser scan.”
One main tool of choice has been the Trimble VX Spatial Station with Trimble RealWorks survey and modeling capability. One reason is its high resolution, integrated, registered imagery and another, because many areas needing as-builts are tightly defined areas of interest like jack-and-bore pits. “High-resolution, registered imagery is absolutely critical to selling scanning in the civil market,” Betit says. And with experience from using a few different types of scanners, he has recognized that planners, engineers, the client, geotechnical people, etc., prefer laser scan data accompanied with digital imagery registered at the time of capture.
“The reality is that you have to pick your tool for the job. And I can launch a VX with any survey crew and quickly get a small scan of a very specific commodity area in the project coordinate system using resection control methods that’s immediately usable and has a registered image attached to it,” Betit says. “If I have to mobilize a bigger scanner, [then]that gets into a whole different cost and work flow issue.”
The Project on Wheels
The strict Bechtel and Virginia Department of Transportation (VDOT) safety protocols for Maintenance of Traffic (MOT) were not an issue for production since the static scanners used on the project never entered the roadway. Static scanning was carried out from adjoining shoulders or in medians during normal work hours. The mobile scanning by Terrapoint moved with the normal flow of traffic. Some static scanning along Route 7 occurred in the late evening around strip mall parking lots when there was little shopping traffic to obstruct the surface. Car dealers along Route 7 cooperated by moving their display cars back a couple of feet so surveyors could see the curbs and road surfaces. To achieve better scan angles to the surface, we placed the scanner on an elevated mast, which was mounted on Riegl’s “Rosie the Scan Truck.” Rosie is a Ford F-350 pickup truck equipped with a scanner mast, an elevating mechanism for the mast and a hydraulic stabilizer system for the truck to minimize scanner movement. The crews were cautious about this system’s height and looked continuously for overhead wires along the route where the mast could become entangled. Scan times were kept within tight windows to avoid traffic.
“Once you’ve been around a scan operation on a road, you quickly learn that you don’t actually want to be standing by the road with a tripod setup if you can avoid it,” Betit said. “You want to be on a truck, elevated, and way more protected than if you had been hanging out on the curb line.” He adds that DTP has bought a scan rack system from Riegl for one of its trucks that is less elaborate than Rosie but is just as effective. Our survey crews radically altered the original rack by adding individual electric levelers for all four legs of the stand. We operate the larger scanners and the VX robotic instrument remotely from data collectors and laptops once the scanner is elevated into position.
Why Scan at All?
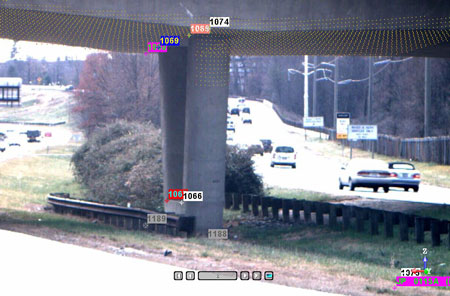
But why would a civil project get so hooked into using laser scanning anyway, Betit asked his audience at SPAR 2009? One reason is cost. It’s as simple as applying advanced technology to reduce field staff. Another reason is safety, a core value of Bechtel. On the Dulles Connector Road, for example, the VX was used to scan bridge piers from a safe distance on the road shoulder behind the guard rails to avoid being engaged with heavy traffic and MOT operations. Yet another factor for implementing scanning is to benefit cash flow, Betit explained. On this project, the client wants to see as-builts every 30 days rather than at the end of the project. Without scanning, Betit contends, surveying will not be able to keep up in a timely manner with certain portions of the as-built field data/ data processing turnaround process unless more survey crews are added.
For monitoring purposes, he continued, operators can use a laser scan to identify a limited scan area and measure it very accurately, and with follow-on scans, monitor any changes that may have occurred even on complex surfaces. But, he says, scan point clouds are not a very useful form of presentation for the average person. He has found that high resolution digital imagery integrated with scan point clouds is by far the most effective way to convey the information captured with scanning to most end users. Also, laser scanning is a type of advanced technology that invites task order scope creep once end users begin to understand the multitude of the scan data uses. On Dulles, Betit shepherded a high-powered construction staff, civil engineers, geotechnical engineers, environmental experts, etc., to agree on what the product scope was and then avoid scope creep over the term of the project.
Possibly the largest and most complex civil infrastructure laser scan project done in the world to date
Betit said the Route 7 laser scan and follow on extraction of 3D CAD entities was one of the more difficult efforts of his life. “The DTP staff didn’t fully understand what scanning was, no matter the number of presentations provided,” Betit said. “Even then, they thought they [either]couldn’t get anything out of it, or that it could do everything.” This initial effort might have been more difficult since, according to Betit, this was the first scan done in the entire global Bechtel civil operations. Ted Knaak, of Riegl USA, a major contributor to the Route 7 product, considers the final product to be possibly the largest and most complex civil infrastructure laser scan project done in the world to date.
But the subject raises important issues on the business side of a scanning contract. Knowing the technology and what it can do is one thing, but specifically contracting those capabilities is another. A core individual or group with experience must put this on paper with specific objectives and procedures, or suffer scope creep and a number of other issues that can be difficult to resolve later in the project.
One case on the Dulles project was typical of these potential scope creep situations. During one of the preliminary reviews of the laser scan data, someone asked Betit if he could measure the location and area of traffic signs with exactness. Of course, the answer was, “Yes.” However, this aspect wasn’t in the original contract. There were two components of this additional request: The sign positions were to be mapped as part of the original mapping scope. The text and size (area) of signs could be carried out by the requestor after delivery of the product using the free viewer provided at delivery. The text and area portions of the request were not added to the scope of the delivered product.
Settlement monitoring is yet another aspect of the project. For Route 7, custom-built Microstation-based utilities were requested, Betit explained. Initially, there was some difficulty matching the construction surveyors’ road surface monitoring results to the laser scans —sometimes they would be up to a few hundredths off depending on how they had transferred local project vertical control to the monitoring area. The Riegl modification of the Phidias software (now Certainty3D) solved this problem by providing the capability to the surveyors, to select survey control information on objects near the monitoring area from the scan field. By choosing agreed-upon objects and extracting 3D coordinates from their scan data, surveyors were able to establish a settlement monitoring vertical control, based on the scan point cloud data. DTP also wanted the 3D point cloud data for the architects to integrate with their BIM models for the two stations under Route 7. Another use for the 3D models from the existing rail tie-in area was to tie them to the Primavera scheduling system using Navisworks software in order to create a 4D (3D objects synchronized with schedule time sequences) scheduling model.
Getting What’s Needed With Feature Extraction
Survey control and scanning tasks were the ‘easy’ part of the project, especially considering the difficulties of feature extraction. As Betit describes: “Conventional field surveying and mapping is basically the art of going into the real world and very selectively and intelligently gathering just the right amount of data to create a model sufficient to be used for engineering design. Scanning is the reverse. It gathers everything within the scan field of view and then you take the data back into the office. Now the survey must be carried out in the same careful and selective manner as you would in the field. The object is to intelligently pick out from the massive data set only what you need to make a model sufficient for engineering design — no more, no less.
“The beauty of scanning compared with conventional survey mapping is that you’ve captured the entire scene, and so when people tell you that they forgot to have you locate something, you have a good chance of being able to pick it up again in the office for them using the original data set.”