This is the story of how the Minnesota Department of Transportation deployed 3D laser scanning to capture a detailed forensic record of the August 1 collapse of the I-35W bridge over the Mississippi River in Minneapolis.
Bradley Canaday, MN/DOT’s Administrative Land Surveyor Manager for Metro Surveys, tells how it began. “I first heard the news about 15 minutes after it happened,” he says. “My son saw the news on television and called me to find out if I was okay. My next call was to my boss, Terry Zoller, Metro District construction engineer leading the recovery effort, to ask if I should come in. He said he’d let me know – he was already on his way to our main office at the Water’s Edge.” Then Canaday realized 3D laser scanning could play a valuable role. “I called Zoller back a few minutes later and left a message saying that we have this laser scanner, which I think would be a good technology for documenting the wreckage as it lies on the ground and in the water, to aid the investigation of why it came down.”
“The next day, early in the morning, we reported to the site,” Canaday continues. “Our first task was to get down there and start establishing survey control of the site. My boss put me in charge of all the survey functions that would take place, no matter which group from MN/DOT was carrying it out. I was the overall survey coordinator.”
Gary Troge, Transportation Specialist in Canaday’s department and MN/DOT’s laser scanning operations lead, picks up the story. “The bridge went down on Wednesday evening, and by Friday morning we had a meeting scheduled with the forensic engineers working on the project.” Troge tells how, in addition to MN/DOT’s existing Leica ScanStation, “Greg Schneider from Leica volunteered the use of a second ScanStation.” Schneider, Leica’s regional representative, “brought it over on Friday. We used it for a while Saturday before getting rained out. Then we used it for many days after that.” Says Schneider, “It’s in the Minnesota nature to reach out and help one another.”
Leica’s no-charge loan under these circumstances was a boon. “We appreciated it no end that he volunteered that instrument to us,” Canaday says. “We had many companies offering their services, some using Leica scanners, but working through service providers would have been too complicated – coordination was so much easier because we could do all the work ourselves.”
What were the complexities of working on site under these circumstances? “Security kept getting tighter and tighter,” Canaday says. “You needed a MN/DOT badge to get access. Without Gary’s team having access to two scanners, it would have been too late to capture a lot of the information we needed” due to debris removal activities, which had already begun. Also, having MN/DOT personnel carry out all the scanning meant “we didn’t have to worry about data walking off into the private sector. It was an extremely sensitive situation because we didn’t know what caused the bridge to go down – we wanted to keep tight reins on this data.”
Continued
Work process
Canaday describes the welter of activity on site. “We had a lot going on – survey crews, two laser scan crews, others dealing with the RTK needs of LIDAR flights. We also had a crew starting recovery of right-of-way monuments. And there were many projects starting up to deal with traffic flows and increase capacity on alternative traffic routes – we had crews working weekends doing construction staking for lane widening, lane restriping” and related work.
How did it begin? “The FBI and the Minnesota State Patrol were on site doing their own survey work, and they had control already set up by the time we got down there,” Canaday recounts. “When we got there, we set additional points and tied their points into our network. I explained to the State Patrol and the FBI that we should all be on the same datum. So my team established x,y,z values on all the points the State Patrol and FBI had used – we established horizontal and vertical control using static GPS, as close to the wreckage as we could – then we gave that data to the State Patrol and FBI so they could orient their data on top of our system.”
Canaday explains the urgent need to re-establish survey control. “When the bridge went down, that wiped out a lot of control that we had established on the site in a previous project. So the first thing we had to do was to establish horizontal and vertical control that everyone could use.” Right away, “we did a lot of RTK work just so we could start scanning.” Troge picks up: “We knew the elevation was not as good with RTK as with static GPS, but we needed to get going right away. After I backed the good static GPS coordinates into the registration process, then registration was very tight – the worst residual error I had was 6/100ths inch in the vertical.”
What other data collection activities were carried out? “MN/DOT had a LIDAR flight going on at the same time, and we had to establish some control for that. So we had a two-person crew set painted targets and get x,y,z data for those targets, so the LIDAR data could be referenced to those control points.” Why the LIDAR flight? “To document the bridge as it lay on the ground. Also, we knew we would be rebuilding the bridge, and our conventional survey mapping was a little sketchy in that area.” The LIDAR survey was carried out by AERO-METRIC, Inc., Sheboygan, WI, and Minneapolis, using an ALTM Gemini system from Optech Incorporated.
AERO-METRIC vice president Marvin Miller picks up the story. “We were called in by MN/DOT,” he says. “I was in contact with their folks within an hour and a half of when the bridge went down, and they were in our Maple Grove, MN office the next morning. We set out a three-pronged approach. One element was LIDAR data collection of the site. We also captured digital oblique photography from a helicopter, and we collected color vertical photography from a fixed-wing aircraft at 1200 feet above mean terrain in order to enhance the LIDAR data with breaklines and for future planimetric feature collection.” AERO-METRIC flew some two dozen missions in all, from the beginning of August through early October.
Deliverables were “the LIDAR data in bald-earth format and point-cloud data,” Miller explains. “We provided orthophotos with a 0.1′ ground sample distance for the NTSB and 0.25′ for MN/DOT. The LIDAR data was collected so as to support the generation of 1-foot contours. We also produced countless digital enlargements from each mission that were used by various agencies.” AERO-METRIC handed over the data to MN/DOT, which in turn provided some first-return data to emergency responders and to the NTSB, according to Peter Jenkins, Photogrammetric Unit Supervisor with MN/DOT. Going forward, Jenkins and Miller say the bald-earth site data will aid design of the replacement bridge.
The key lesson? “It was a great collaborative effort,” Miller says. “MN/DOT was setting survey control for us, then helped us get access to the site – not only on the ground to set up base stations for our aerial photography and LIDAR missions, but also helping us get access to those congested air corridors.” He sums up, “The success story is how all these different people and organizations cooperated to mobilize and respond quickly to this emergency.”
In addition to this, Canaday says, “the FBI was on site doing a lot of their own surveying, climbing over the wreckage” to capture data with a variety of tools, and shortly after MN/DOT started scanning, the FBI also began using laser scanning as one of its tools to document the site.
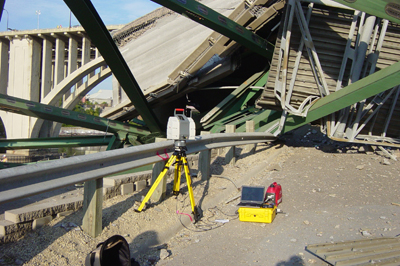
What other challenges did MN/DOT encounter? “OSHA had established a safety zone, a red zone, which marked certain areas you couldn’t get into until the area was cleared. That’s where we used total stations to set stubbed-in points to set the scanner on.” Another challenge was “getting through all of the security checkpoints just to get to the bridge to do our work. Until the site was secured by a chain link fence, we had multiple checkpoints to go through and to sign in and out of.”
From August 3, the second day after the collapse, the MN/DOT team was “down there scanning for 13 overtime days, with both scanners going,” Canaday recounts. After that, scanning continued at intervals. “On Labor Day we had a crew scanning the steel in the river.” Then after work crews removed decking material, “we were out there again scanning the exposed steel.” In all, “we captured over 372 million points from 68 setup positions,” Troge reports. The large number of scan positions was due to “the complexity of the bridge geometry to begin with, and then the fact that it was wrecked.”
Continued
Unique factors
What was it like working in the glare of publicity? “At the very beginning, members of the public were taking pictures of us scanning,” Canaday says. “But then the city and county police shut down the local streets and walkways around the site – even the airways. So after the first few hours, we didn’t have anyone taking pictures of us. But then a few days later, as we were scanning, two busloads of media pulled up on the Tenth Avenue bridge, which had been closed off, piled out, and started. That lasted only 15 minutes or so.”
The somber work, needless to say, was far different than routine survey projects. “It was not like a regular construction or demolition job,” Canaday recounts. “There were bodies. We never saw any, which was fine with us. But any time there was going to be a recovery, we were ordered away from the site.” This mark of respect for victims was nonetheless disruptive to scanning operations. “‘Here I have an $80,000 piece of equipment – at least let me take it away,’ I’d say. But we were told no” – that the recovery of victims’ remains took precedence. “For hours at a time we’d have to leave the site.”
Troge notes, however, that this was made less disruptive by the ScanStation’s use of dual-axis compensators. This feature, taken from total station technology, means the instrument always knows “which way is up” and reduces the need to place, scan and survey targets for accurate registration. Troge says this helped minimize disruption from the stop-and-go work process mandated by the need to vacate the site during recovery. “Even if you have to shut down,” he says, “you can pick up right where you left off.”
The nature of the work took a toll on all involved. “There were a couple of days” where recovery of remains “happened several times during the day,” Canaday recalls. “Working on that site was different from any other construction site we’ve ever been on. It affected everybody. I didn’t think it was bothering me too much. But then one day at home, my daughter was going to cook something in the microwave. I told her to cut some little slits in the wrapping, but she started cutting great big slits, and I yelled at her. Then I realized it was the bridge work getting to me.”
How did the department respond? “We had a Critical Incident Stress Management (CISM) response team that MN/DOT had set up,” Canaday says. “Every so often we have a maintenance person struck and killed by a motorist, so they have a response team to help people deal with grief. On the bridge project I had been thinking that we were all right, but after I yelled at my daughter, I called in that team. And I wasn’t as close to this as some others were – like Gary [Troge], who was right down in it every day. Working with the CISM team went really well. I think it helped us all.”
Next steps
As of mid-October 2007, “we’ve registered the data,” Troge told us. “MN/DOT has looked at it some, but right now their main concern is still removing the steel from the site. They’re not using the data yet.” Other than registration, the scan data has not yet been post-processed in any way, Canaday adds.
Canaday expects his team’s data will be used by the National Transportation Safety Board (NTSB) to assist in the search for what caused the collapse. At present, he says, “we’re waiting, because work crews are still removing steel,” and NTSB authorities pursuing the cause of the failure are still focused on metallurgical testing of the steel samples. “We’ve heard that the NTSB is going to take our scan data of the wreckage, but no one has yet asked us for our scan data.” At present, Troge adds, “The authorities are still focused on cleanup, to be able to start the new bridge construction.”
We understand that, due to potential lawsuits, federal authorities are constrained from discussing this activity in detail at present – we’ll continue reporting as more information becomes available.
Continued
MN/DOT laser scanning investment drivers
Before the I-35W project, “we had done quite a few laser scanning jobs” since purchasing the Leica ScanStation in January of this year, Canaday recounts. How did his department get involved in laser scanning? “I worked for four years to get a laser scanner here at MN/DOT,” Canaday says. “I had to work to get the money – these are fairly expensive piece of equipment. I was able to get half the money from our statewide survey equipment committee, then my boss convinced his higher-ups that this was a good investment, and he came through with the rest.”
“One of the biggest things I’m concerned about is safety,” Canaday says. “This technology keeps our people out of traffic, and keeps lane closures down.” Troge agrees: “What I really like is that we’re able to scan high-traffic-volume freeways, for example, and get accurate DTMs without anyone having to work in the roadway.”
Productivity is another plus. Indeed, with recent staffing reductions, “technology is the only way we’ve been able to keep our noses above water,” Canaday says – “not only in our design surveys – right-of-way surveys and location surveys – but also in construction. Five years ago we had 90 people in the Metro Survey department. Now that’s down to 60. Yet this past year we’ve done some of our biggest projects ever with MN/DOT” – technology is how the Metro Survey department has been able to keep up and deliver.
Troge points out the economic benefit as well. “Another use we’ll have for laser scanning is to save MN/DOT money on quantity surveys.” He described one project in which he scanned a large area, 50 to 75 feet in relief, which will be excavated by a contractor. “We scanned it and came up with an extremely accurate volume calculation” on which the contractor will base its cost.
Why the Leica ScanStation? “A big plus was the 360- x 270-degree field of view, where you can go up and over,” Canaday says. “FOV is a big issue for us because we’re a transportation department. We deal with bridges a lot – when we set up under bridges, it’s extremely helpful to be able to scan straight up.”
Another selling point was “the partnership between Leica and Bentley,” says Troge. “We use MicroStation and GeoPAK, and we know that the information will transfer the way we need it to. A big plus for me was the ability to export DTMs to GeoPAK.”
Conclusion
“Clearly we hope the work we did helps the authorities figure out what happened,” Canaday tells us. “But it also brings out the need to use scanning to look more closely at our existing bridges, highways and other infrastructure. With this technology we can collect more information, and more accurate information, on what’s out there” – information that “other departments and authorities can use to help prevent future tragedies.”
We agree. In the I-35W accident, 13 people lost their lives. Perhaps one outcome of this tragedy will be increased investment in 3D laser scanning and other technologies to help the nation improve its maintenance and repair of critical infrastructure.