Esri released a web-based mapping application built on the ArcGIS API for JavaScript for viewing and analyzing global land-cover changes. Called “Sentinel-2 Land Cover Explorer”, the app provides a combination of Esri maps, image services, spatial analysis tools and ESA Sentinel-2 imagery at 10m resolution. All these components are combined and presented in a browser-based app that can be accessed without additional software or login credentials.
The app aims to bring Land Use/Land Cover maps closer to decision makers at different government levels around the world, who can use the imagery and analysis tools to inform policy and land management decisions through contextualizing and quantifying the impacts of earth processes and human activity on the environment. The app is structured around a web-based version of Esri’s own high-resolution global land-cover map, derived from Sentinel-2 satellite imagery. Sentinel-2 is the name of an earth observation mission that is developed and operated by the European Space Agency. The app, map and source satellite imagery are part of Esri’s Living Atlas of the World, an online collection of apps, maps and data layers.
Visualizing and Analyzing Change
The app offers annual global land cover series from 2017 to 2022, that consists of nine major land cover categories. Annual updates of these series enable the detection of shifts in urban areas, vegetation and crops, among others. This change detection process has been automated using AI, as a result of a partnership with Impact Observatory and Microsoft. Impact Observatory created a deep learning model that produces a global land cover map in days after processing a year of earth observations. To train its AI land classification model, Impact Observatory used a training dataset of five billion human-labeled image pixels.
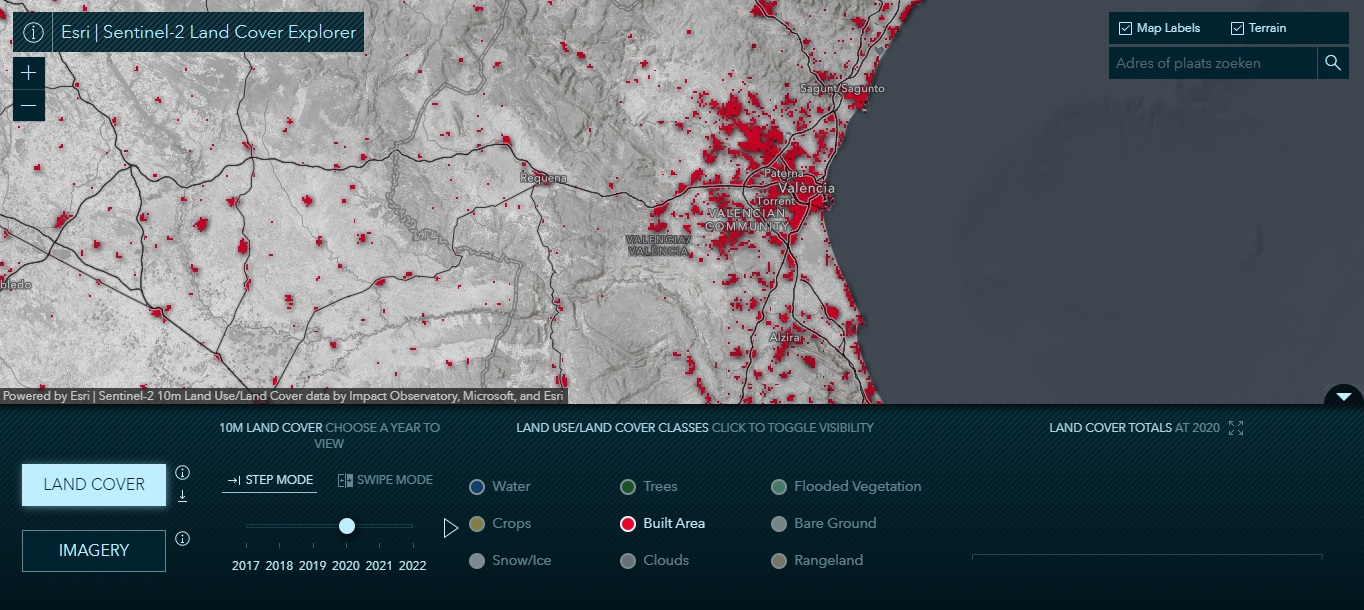
The app’s different land cover categories are visible in the center of the dashboard of the application under “land use/land cover classes”, after choosing the left tab “land cover”: water, crops, snow/ice, trees, built area, clouds, flooded vegetation, bare ground and rangeland. The “clouds” category is used to mark areas on earth that are not visible due to cloud coverage.
The app provides various ways of detecting and reporting changes in Land Use/Land Cover (LULC): visual change analysis, statistical change analysis, visual change validation, and dynamic charts for percentage changes over time. For a better user experience, users can create bookmarks to points of interest for future use, or easily share their results with others. The app also provides offline capabilities to download data for a specific area and year of interest.
Visual and statistical change analysis tools
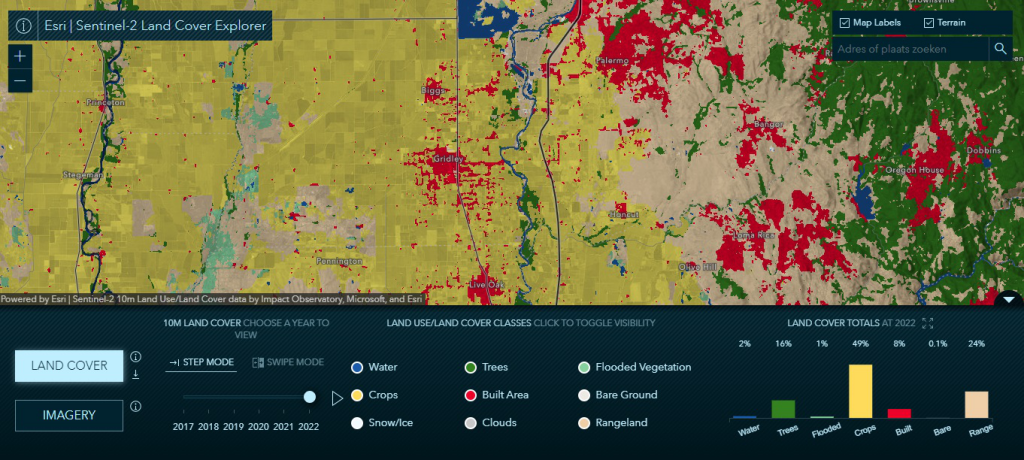
GIS users will recognize the functionality to perform visual change analysis. A first option is a swipe tool, where two different images (each for a different year/month) are laid on top of each other. A comparison can be made using “swipe mode”, a vertical bar that enables a side-by-side comparison of land cover change for an area of choice. The second option is Step Mode, allowing the user to toggle between different years (and accompanying satellite imagery) using horizontal radio buttons. Based on the current map extent, the app calculates percentages of the different land use categories when using the Step mode. In Swipe mode, percentage changes (positive and negative) are calculated to see if there is more or less of a certain category over time.
Additional rendering tools for visual Investigation and validation
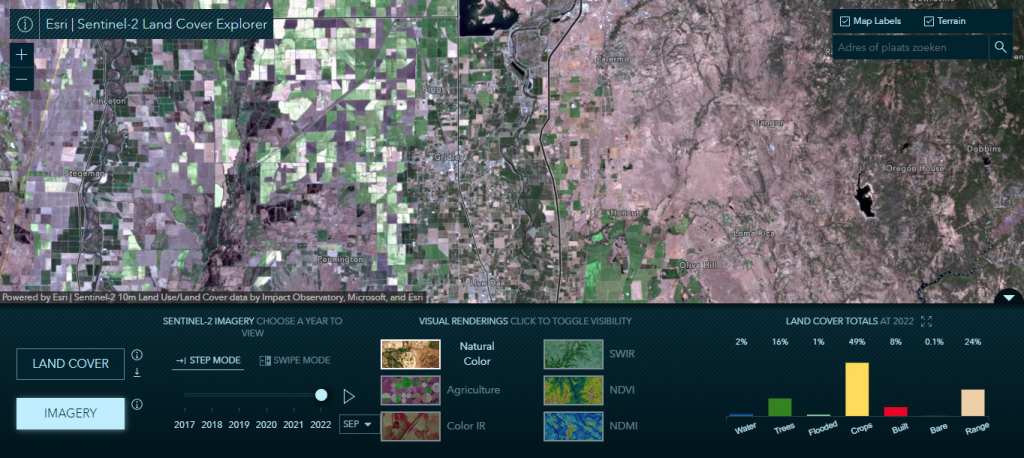
In addition to visual and statistical change analysis, the app provides six different visual renderings of different satellite imagery bands to apply both Step and Swip modes to validate the different land cover classifications visually: Natural Color, Agriculture, Color Infrared, SWIR (Short-wave Infrared), NDVI (normalized difference vegetation index, an indicator of vegetation greenness) and NDMI (Normalized Difference Moisture Index, an indicator a crop’s water stress level).