Earlier this month, Esri announced a new joint partnership to create the Chief Equity Officer Network, aiming to assist governments and businesses in addressing equity issues. Along with Esri, the partnership includes the Harvard School of Public Policy, the National League of Cities, the National Association of Counties (NACo), and Bloomberg Philanthropies.
Equity has become one of the top priorities – if not the top priority – for government entities and businesses over the last few years, but organizations are not always successful in getting to the root of some of their problems. As Esri points out in their announcement of this partnership, “to implement these policies, organizations must understand that equity challenges are fundamentally a geographic issue.”
Particularly for local governments, an understanding of the geographic realities in a given area is a crucial base on which to build policies around improving equity, an idea that is being embraced by this network. In their announcement, the network says their mission is “to find solutions that make equity strategic and actionable by using geographic information systems (GIS) technology as a foundation.”
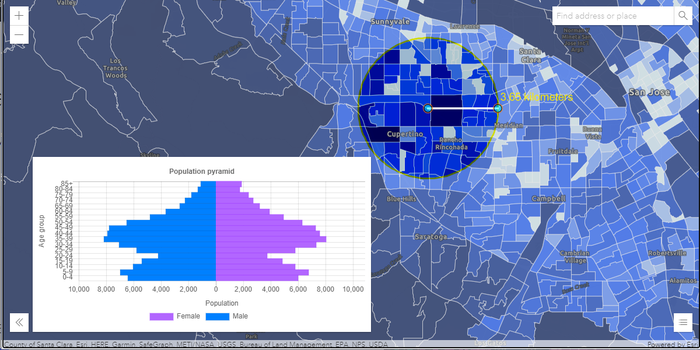
This, of course, is where Esri excels as the leading provider of GIS software, with a number of use cases for the software, including work with responders in search and rescue operations. Additionally, they are no stranger in this work in the equity space; it’s just generally been part of work with individual local government organizations rather than a network like the one being formed here. Using ArcGIS, Esri helps entities use maps and spatial analysis to help better contextualize inequities in a variety of ways over a given area.
Some examples given on the Esri website of areas on which to focus for this type of work include starting with a base map showing racial demographics over areas, and adding data for things like where healthy and affordable food is available, showing potential disparities in access to quality education, and creating tools to increase transparency in policing in a community. As a couple of examples of how this is used, the city of Charleston, South Carolina last year shared their own interactive racial equity story map, created with ArcGIS, with Asheville, North Carolina sharing similar projects.
It’s true that these kinds of tools are being used already by individual cities, counties, and states, but introducing GIS into these equity processes on an organization-by-organization basis is sure to lead to slow-moving adoption. That’s why this partnership could be such a key in simply driving education through large organizations, particularly the National League of Cities and NACo, both of which work closely with the groups that could most benefit from this kind of analysis.
Improving equity in an organization or locality is a noble goal, to be sure, but often it’s much easier to declare it a priority compared to actually finding actionable solutions. To repeat what was said above, these issues are, at their core, geographic. GIS tools from Esri provide the information necessary to contextualize conditions which are leading to inequities, and more importantly point towards action items to make necessary improvements in policy.
The sentiment is echoed by NACo chief research officer and chief economist, Teryn Zmuda, who said in a press statement that the organization is “thrilled to collaborate with Esri,” and continued, “GIS provides the geographic lens for local leaders to translate data, which can be used to approach, discuss, and address equity issues within and across jurisdictions.”
Sophia Garcia, Esri equity and civic nonprofit organizations industry specialist, added, “Equity is about creating thriving communities for all residents. To do so, organizations need to implement solutions that meet the needs of the underserved and unserved, whether those conditions stem from racism, variations in physical or mental health, lack of access to services, the effects of climate change, or other circumstances. GIS provides the unique ability to map these complex problems, understand the data, and take more effective action to solve them. We are proud to be able to contribute to this partnership.”


