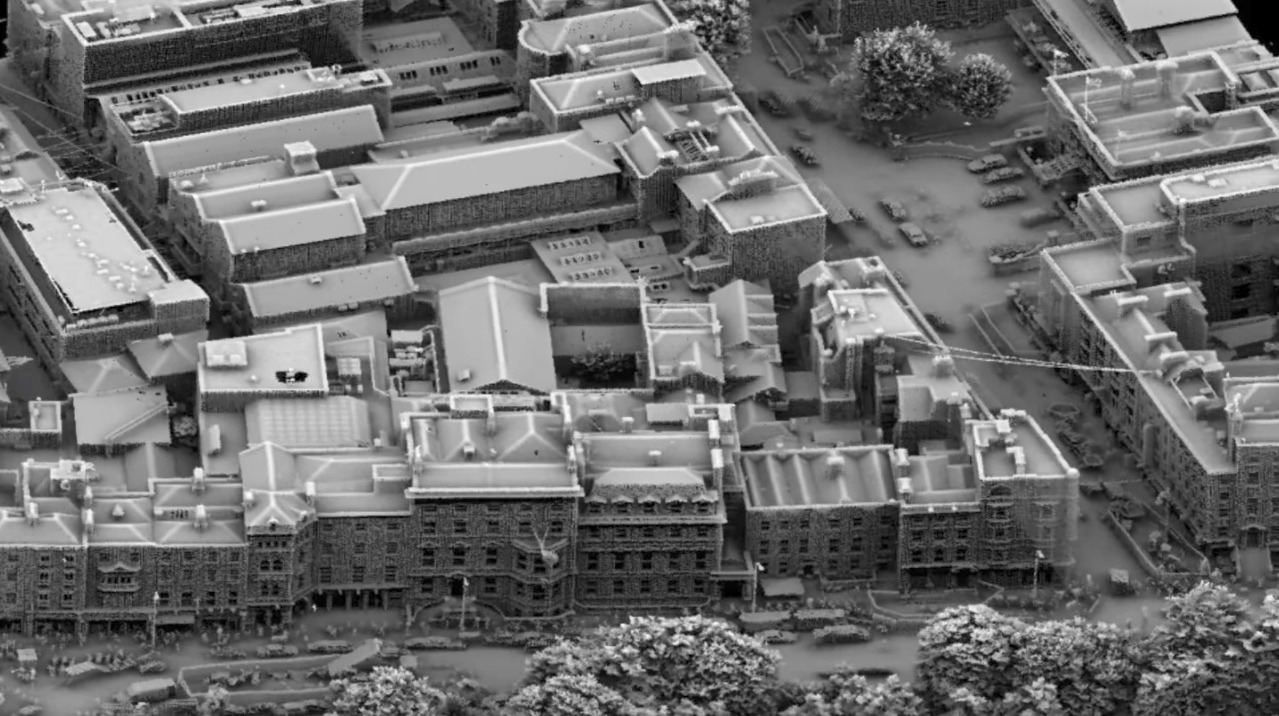
Recently professor Debra F. Laefer, with NYU’s Center for Urban Science and Progress–released what the center is calling the world’s densest urban aerial lidar data set. Here’s how it was described in the original press release:
At over 300 points per square meter, this is more than 30 times denser than typical LiDAR data and is an order of magnitude denser than any other aerial LiDAR dataset. The dataset also includes the first ever urban scan with the fullwave form version of the data, as well as affiliated imagery and video. The unprecedented comprehensiveness of this multi-layered dataset enables new opportunities in exploration and modeling. It also sets a new standard for what can be collected and used by cities around the world. The data and affiliated information is now publicly available through New York University’s Spatial Data Repository (SDR) here for both personal and commercial use.
To find out more, SPAR3D caught up with Dr. Laefer, who explained the technology and the techniques used for capture, as well as the issues facing the team as they attempt to make the data useable to everyone who needs it.
SPAR3D: Can you tell me more about the data collection workflow? For instance, what kind of lidar technology did you use? I would assume you used Geiger-mode because the data set is so dense.
Dr. Debra Laefer: Importantly, we did not use Geiger-mode. We instead used a TopEye system S/N 443. Imagery data was captured using a Phase One camera system. The average flying altitude was 300m with a total of 41 flight paths with a special orientation and multi-pass approach that we developed that sets the orientation of the flight patch diagonal to the main orientation of the street grid. We then used a 67% overlap to rid us of the traditional blindspots that arise from nadir-oriented equipment.
An interactive map of the flight paths:
What is the value of full-waveform data for city exploration and modeling?
Through sparse deconvolution we are able to resolve echo information with as little as 15cm separation (as opposed to 60-70cm assuming a Gaussian approach. This would enable us to harvest up to 4 times as much information where the laser beam is encountering multiple surfaces. This could greatly enhance facade data recovery, which is always difficult because of the nadir orientation of the equipment. Notably, what you are visualizing is only the discrete data and not the enhanced processed full-wave form. Additionally, the fullwave form may provide important insights to aid automated material classification, which would profoundly improve modeling for many urban problems such as urban heat island, blastwave and noise propagation prediction, seismic vulnerability.
Is it feasible to perform this project again in the future to attain a new dataset and compare changes? Is that even in the scope of the project?
We have already done this in the form of our previously published 2007 data, for a slightly smaller area wholly contained within the 2015 data. The flight pattern and flight height were similar, but the improved equipment enabled a 50% increase in data density. Future data acquisition and comparison of that acquisition should be readily attainable using typical industry standards for referencing, as were applied during this project. We are now hoping to do this for a section of New York City to show that our approach works for very high-rise cities as well.
Now that the data for Dublin is available (and other cities will be available in the future) I want to ask—Do you think that everyone who could benefit from the data also has the skills to use it? I understand that city planners or engineers might have the expertise, but what about those who would use it infectious disease tracking? Or, entrepreneurs?
This is a challenge. Thus, we are actively working on a project call urbaneyes that would bring to market an entirely new spatio-temporal database system. Our approach incorporates new indexing strategies that both exploit distributed computing and fully support the integration of a vast array of data types, formats, and granularities that could be queried easily over both time and space. Eventually such a system would be no more difficult to use than a common GPS-based navigation system