NIST, FHA, AASHTO team for novel photogrammetry application
WASHINGTON – When the Interstate 35-W bridge in Minneapolis collapsed on Aug. 1 2007, it’s no secret that a swath of people was charged with figuring out why. Turns out it was a bad gusset plate, the piece of steel used to join steel beams. The plates, according to investigation by the National Transportation Safety Board and the Federal Highway Administration, were about half as thick as they should have been.
As you might expect, this led the NTSB to recommend these gusset plates be included in evaluating a bridge’s load capacity. But how to do that?
Mark Iadicola, an engineer with NIST, has a 3D answer. You can see the full write-up of his investigation here, but he essentially applied a version of photogrammetry called digital image correlation, using software from Correlated Solutions, which gathers images at high frame rate from two white-light CCD cameras and measures full-field 3D deformation.
“I was most interested in the strains on the plate,” Iadicola said in an interview with SPAR, “so the 3D displacement was just the first step; then it was deducing the strains from the 3D displacement field.”
While Justin Ocel from the FHA was also using a laser scanner at the same time to investigate where the bolt heads were moving in 3D space, digital image correlation’s benefit is that the movement can be mapped in 3D space in real-time, allowing for the strain calculations.
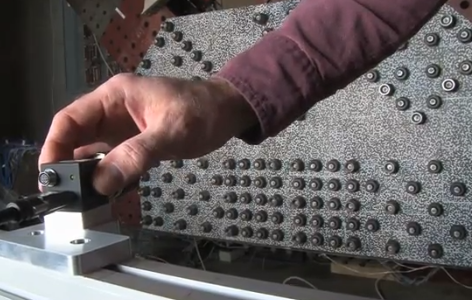
“The system is able to take a shape measurement first,” said Alistair Tofts, director of sales and marketing at Correlated Solutions, which was founded by University of South Carolina professors in 1998. “Then we track how those individual points move on a subset level. We take an 11×11 pixel subset and monitor how that deforms in all three axes. Therefore we get a UVW [the change in direction of the XYZ], we get a displacement field, and then from that we can calculate strain, the percent change.”
Tofts said the company’s software has been used to assess strain on objects seen through a microscope at the micron level all the way up to objects 50 meters in length. One of the only drawbacks is that there must be some kind of repeating pattern applied to the surface of whatever’s being measured. With only targets, or with a projected pattern, movement in 3D can be mapped, but it wouldn’t be possible to assess strain.
So, is Iadicola’s method for assessing strain ready for the field? “For the purposes of this particular projects, it was an in-the-lab kind of thing,” he said. “There’s been a lot of interest in bringing it out into the field, but there’s always difficulties in doing that. The technology itself is probably good enough, but it’s the in-the-field issues you need to deal with, getting the pattern on the steel, getting the lighting right, we just haven’t done this in the field to the point where every state DOT can just do it.”
For more information on Iadicola’s work, you can watch the following video, created by NIST: