When climate data gets dense and technical, it can feel inaccessible to the communities who need it most. That's where Stephanie Sun, a program manager with the Gulf of Maine Research Institute's Community Climate Action Team (CCA), sees geospatial tools like story maps making a real difference.
GMRI's CCA team works with coastal communities across Maine to help them achieve their climate action goals, a mission that sits across three areas of focus: climate literacy, capacity support, and technical assistance. Geospatial work, Sun notes, touches all three.
"A lot of the time, when we're supporting communities with things like vulnerability assessments, that information is really dense and it's not very approachable," Sun explained. "That's where story maps really come in as a major communications tool."
Validating Local Knowledge Through Maps
One of the most powerful aspects of GMRI's story map work is the way it puts community knowledge on equal footing with official data. Flood maps from agencies like FEMA carry a certain authority, but they're built on models that don't always match what residents have actually experienced. This is due to their use of historica data rather than future projections, meaning they often may not align with what communities experience in terms of flood impacts. When GMRI works with a community to map where they observed flooding during a major storm, and compares that to official documents, the result can be both revealing and empowering.
"Seeing their knowledge reflected geospatially has been really powerful, and a validating experience in many ways," Sun said. "Maps come from this position of authority, and I think being able to place community experience alongside that technical information becomes a really unique learning experience."
This approach reflects a broader philosophy at GMRI: bringing together scientific data and local knowledge to find what Sun calls "the magic of geospatial work."
Deciding What to Visualize
Choosing what to include in a story map is as important as the data itself. Sun says the team works closely with community members from the start to understand what they're actually trying to communicate - and what they're not.
"It's so easy to get caught up in the details of the data itself," she said. A flood extent map, for example, might show a centimeter of water or a foot of water, two very different scenarios that require different communication strategies. Being conservative without understating the problem, and being transparent about data limitations, is a constant balancing act.
One practical technique the team has developed: limiting how far users can zoom in on maps. "We know folks want to figure out what's going to happen to their house," Sun explained. "So it's always about providing data in context and leveraging the fact that on story maps, we can set those types of limits."
A Collaborative, Community-Centered Process
Story maps at GMRI rarely exist in isolation. They're typically tied to a larger project like a vulnerability assessment, a community science initiative, a multi-year flooding study, and designed as one piece of a broader communications strategy.
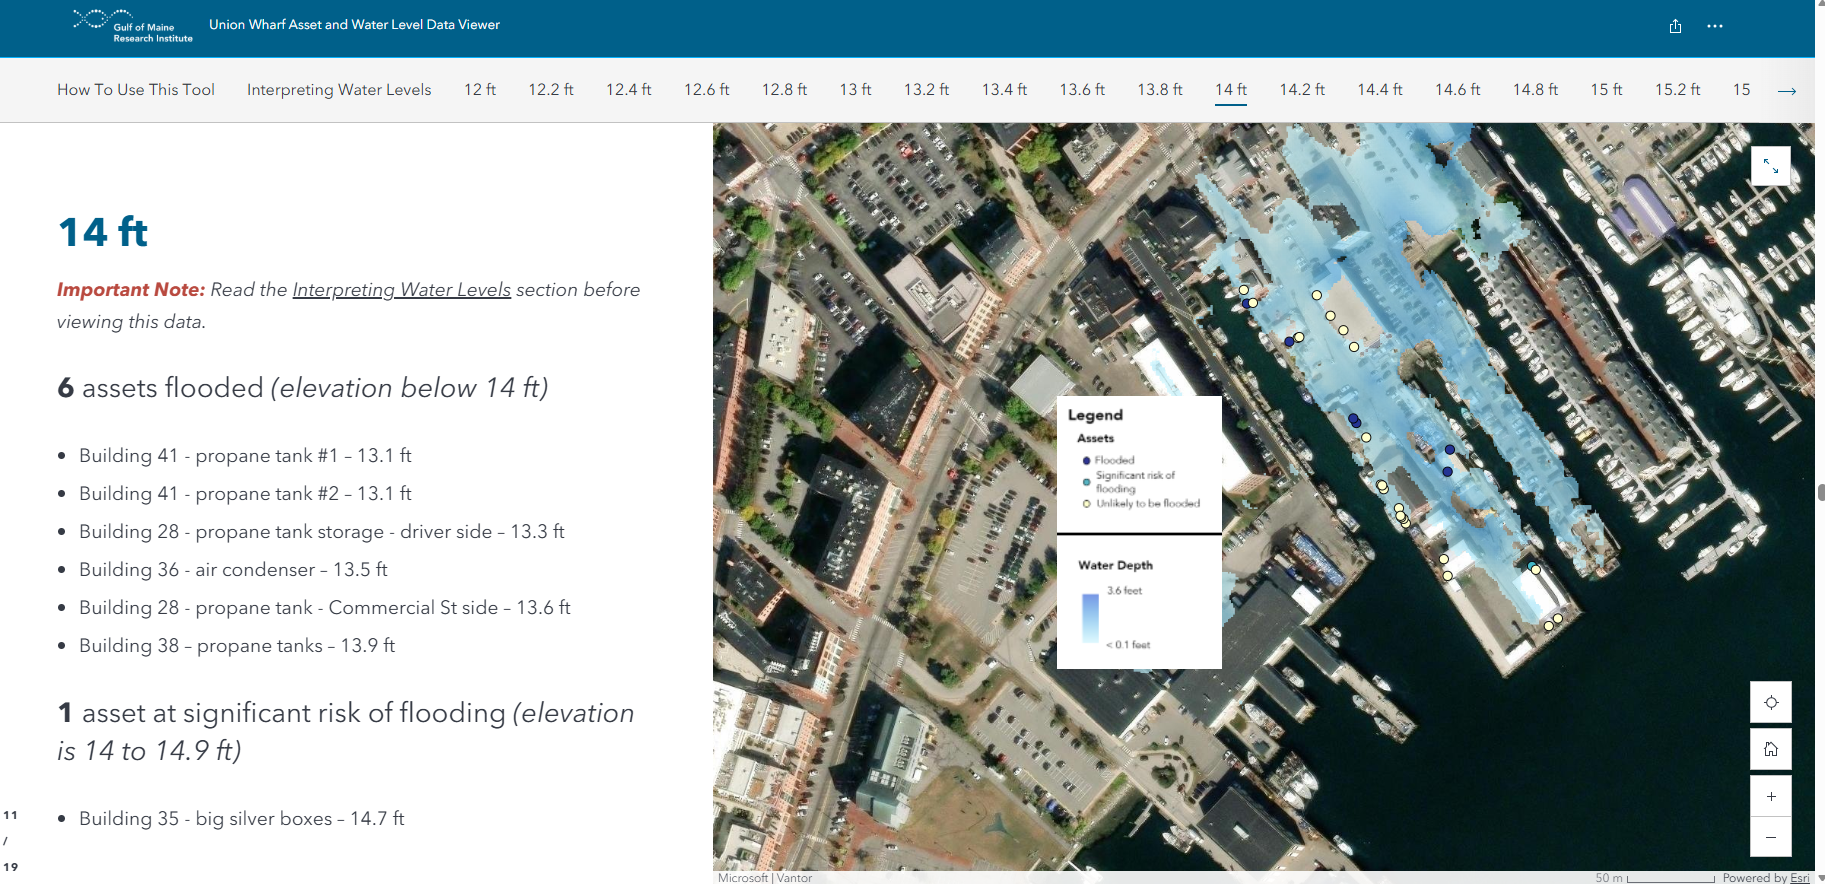
A standout example is a technical story map created for property managers at Union Wharf in Portland, an area infamous for flooding. Built over three years of close collaboration, the tool was designed so that when a storm is approaching, managers can quickly look up a specific water level and get all the critical information they need at a glance. "That information needs to be quick, it needs to be easy to understand at just a glance," Sun said.
GMRI also makes a point of recognizing that they're based in Portland but work with communities up and down the coast. Making space for communities to tell their own stories, including providing historical context, is central to how they approach each project.
Reaching Students and the Next Generation
Story maps have also found a natural home in classrooms. GMRI partners with an in-house education team that supports curriculum development around coastal flooding and works closely with educators. Sun says young people respond especially well to the interactive format.
"Students love to zoom around and have the space to point out what's interesting to them," she said. "It's so much less prescriptive than a report. A story map allows people to add context and have a conversation." Teachers have found creative ways to deploy the maps in their classrooms, and intergenerational engagement remains a core goal for the CCA team.
Looking Ahead
As GMRI continues to develop and refine its story map work, Sun is thinking about what comes next not just for the institute, but for the communities they serve. Her hope is that the tools and knowledge don't stay within GMRI, but spread outward.
"I would be really excited to see more communities equipped with knowledge and access to these tools," she said. "I would love to see how they might take the same data that we have and create their own story maps too. It'd be really interesting."