

Esri announced a new collaboration with Microsoft that includes mapping and analytics capabilities inside Microsoft Fabric. Fabric is a new data product offering from Microsoft that is enhanced with core Esri capabilities to create interactive visualizations and maps. The collaboration was announced at the Microsoft Ignite event in Seattle in November of this year.
Fabric is Microsoft’s most recent data product release, combining data engineering, data lakes, data warehousing, machine learning, and AI in a single platform. They’ve dubbed it the “greatest release since its SQL Server database.” Fabric was announced earlier this year and about 25,000 organizations have already used it, per Microsoft, but is now generally available to the public. Microsoft Fabric combines capabilities of Microsoft Power BI, Azure Synapse Analytics, and Azure Data Factory to create a single, unified software-as-a-service (SaaS) platform with multiple core workloads.
Including 140-plus spatial functions and tools
By including Esri’s spatial analytics and mapping capabilities inside of Fabric, it extends its technology beyond Esri’s own ArcGIS environment. Fabric is a unified analytics platform for data scientists, data engineers, business analysts, and their stakeholders to discover patterns, trends, and connections inside data. By adding Esri’s spatial analytics capabilities to the mix, yet another dimension is added to this process, accelerating time to insights while also yielding new insights by providing a spatial context.
More specifically, Fabric provides a unified collection and coordination of data assets that pairs Esri’s spatial analysis tools with an intuitive user interface and user experience (UI/UX) that includes the ability to perform visual analytics within the context of location, 140-plus spatial functions and tools, native integration with Power BI and M365 apps, an interactive mapping experience via ArcGIS, and a unified platform to share and access organizational data. This means, for example, that results of spatial data analysis inside Fabric can be brought into Microsoft 365, across the Fabric environment, or explored further by leveraging the interactive mapping capabilities and SaaS offerings in Esri’s ArcGIS technology stack. More info can be found here.
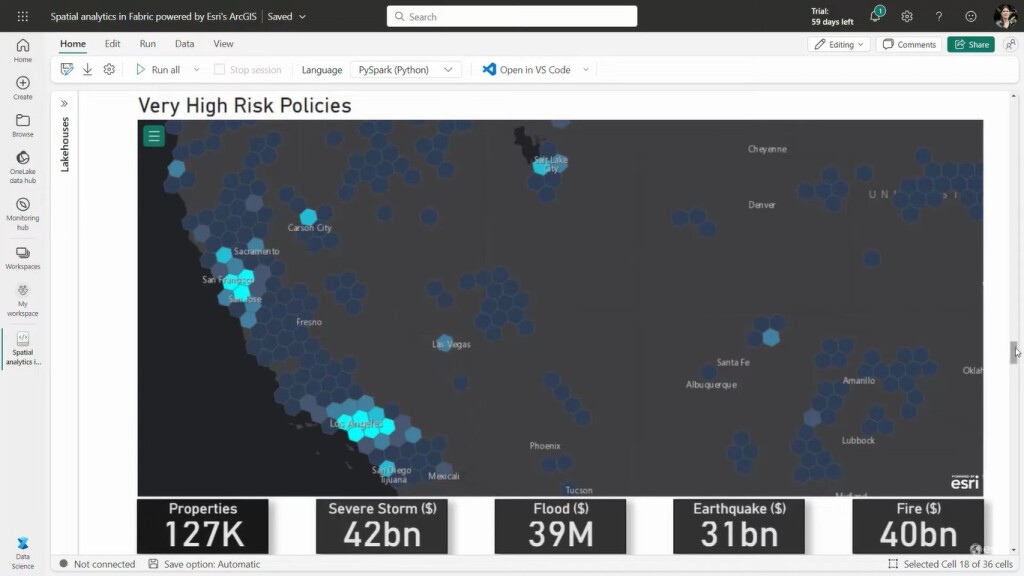
A preview video showing Fabric’s spatial analytics
An online video shows a preview of Esri’s spatial analytics capabilities inside Fabric, which will be made available in Q2 of 2024. The video contains various examples of how a spatial perspective can provide context to a dataset, create new insights, and expose spatial patterns. The first example covers the predicted impact of natural disasters on insured properties. In Fabric’s data science environment, a dataset from Microsoft Data Lakehouse is ingested inside Fabric containing about 2.5 million points for insured real estate properties. By creating point geometries, the data is displayed on Esri-provided base maps for context inside Fabric.
Next, a more complex analysis example is covered, showing the risk of different insurance policies geographically. A dataset from Esri’s ArcGIS Living Atlas of the World, with data for FEMA’s National Risk Index, is joined with an earlier dataset of insured properties so that each policy is enriched with a risk rating. This spatially enriched dataset can now be written back to the Microsoft Data Lakehouse platform for additional analysis and modeling.
The final example analyzes the impact of natural hazards. It uses a dataset with the probability of hurricane force winds over a five-day period that is spatially tied to a dataset of insured properties through a spatial join. Now, information is contained for each property regarding the likelihood of hurricane force winds. The enriched data could be used for interactive exploration in Power BI to identify the total insured value by probability of hurricane force winds.