
The web is buzzing about Nokia’s Ovi Maps – and rightly so. The new 3D interface they’ve debuted, allowing you to take amazing 3D fly throughs of some of the world’s most beautiful cities, is a revelation. If you haven’t played with it yet, do so now by clicking here and wasting a significant part of your day.
I recommend starting with New York, as the skyscrapers best optimize the 3D effect. (You’re going to need to download a little Ovi plug-in, but it only takes a couple of seconds. Just do it. Trust me. Also, make sure you notice the “Pick a City” button in the lower left hand corner. It’s not immediately apparent.)
For those less adventurous of you, this is what you can see of New York:

It’s much, much cooler when you can spin it around and dive into it and run into skyscrapers by mistake, believe me. There are currently 20 cities you can check out, which are obviously the ones where they’ve done the flyover and integrated the image information with the lidar data.
Many of the write-ups you’ll see of this – like this one from Fast Company, or this one from MIT’s Technology Review – focus on the fact that c3Technologies supplies much of the back-end technology to make the interface happen, which must mean that they put out a better press release or something. Also, people seem to love the whole angle where c3 developed the technology for the aerospace industry and it was supposed to guide missiles, blah, blah. I think it’s overstating things to go with the whole swords-to-plowshares meme here. If we started counting up how many consumer applications started out as military applications we’d have a pretty long list.
The real question is how Nokia is actually going to make any money off this 3D interface. At the moment it’s a shiny toy and a great time waster, but it’s unclear where the revenue is going to come from.
Here’s Nokia’s Michael Halbherr from Ovi Product Development talking about Ovi’s direction right before his keynote at the Where 2.0 conference (which I’m really feeling like I should have been at):
Much of what he’s talking about is the 2D – the rich mapping APIs they’ll be offering, the routing stuff, the advanced search functions, etc. All of which basically follow the Google model. Are they really going to do it so much better that they’ll be able to overcome Google’s branding and interface with its ubiquitous search engine, etc.? Show me all the market studies you want, but I’ll tell you right now that Bing brought exactly 1.2 percent of the search traffic last month to SPARpointGroup.com. Yahoo beat Bing handily.
Also, note that Halbherr more than once refers to the 3D interface as “eye candy” and “really cool.” I totally agree. But that’s not exactly code for “huge revenue driver.”
Maybe the most interesting thing he says involves his reference to how Navteq’s “industrial capture process” is being dove-tailed with user additions. How is that going to work? How do they mesh survey-grade laser scan data with the photos from my iPhone? It makes the head spin.
But I do have to admit the interface is addictive. I can’t stop showing it to people here in the office and I’ve been surfing the streets of New York City like Spiderman for the last half hour. Seems like there’s a model here for advertising a la Hulu and other streaming video sites, where an add might occupy a corner of the screen for 30 seconds at a time. But there’s so much competition for advertising dollars…
There’s also the fact that as you get more specific in your detail you need to refresh the maps all that more often for the user experience to be genuine. Look at the billboards in New York’s Times Square: How long will Mary Poppins be playing for? Dawn of the Dead 2?
Although, I have to admit that one of the coolest things about the 3Dness of this is how the sun plays into the images. Check out the difference here between one side of Helsinki’s Suomenlinna area
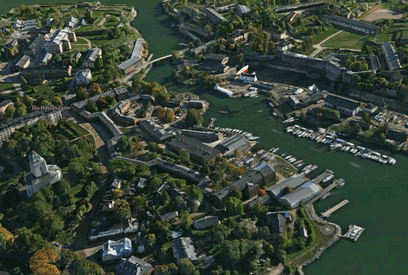
and the other.
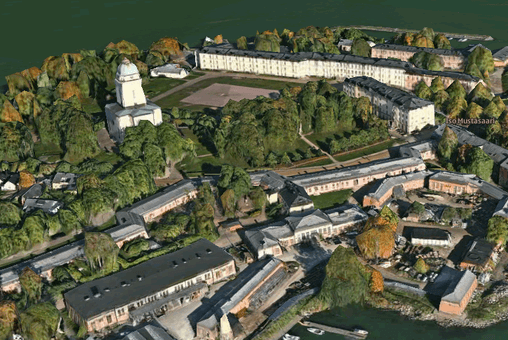
It almost makes it feel live, and it definitely makes it feel like more than just a computer simulation.
Back to potential applications, though. Since Halbherr is talking about full APIs for just about any platform, mobile or desktop, it would seem that you could back this interface into just about anything.
Off the top of my head revenue-generating applications (with the assumption that maybe the top 500 cities will eventually be mapped), other than sell ads for people to see when wasting time:
• Sell it to the online travel sites so that when they show you a hotel they also can show you the walking route to the major tourist attractions. Sure, you can show me an overhead map, or the Google map where I have to click the little arrow, but this is way cooler and you could do pre-programmed animations where I don’t actually have to do anything. Then the hotels pay to have this service linked to their hotel. You don’t pay, you don’t get the cool animation. Chance of that actually being sellable? 30 percent?
• Sell it to colleges and universities so they can set up virtual tours of their campus and the surrounding area to entice potential students. As in: “Click here to walk the campus.” Could be either pre-programmed or just embedded and the kids fly through. Chance of that actually being sellable? 20 percent?
• An education app that can be downloaded to tablets to teach kids world geography? $4.99 a download? Chances of that actually being sellable? Well, some well-meaning parents would buy.
Anyway, you get the idea. Wild, wild west kind of stuff here. Maybe most importantly, though, another application that gets the mainstream thinking in terms of real-world 3D data and application. That can only be good for those of you armed with data capture devices and a business plan.